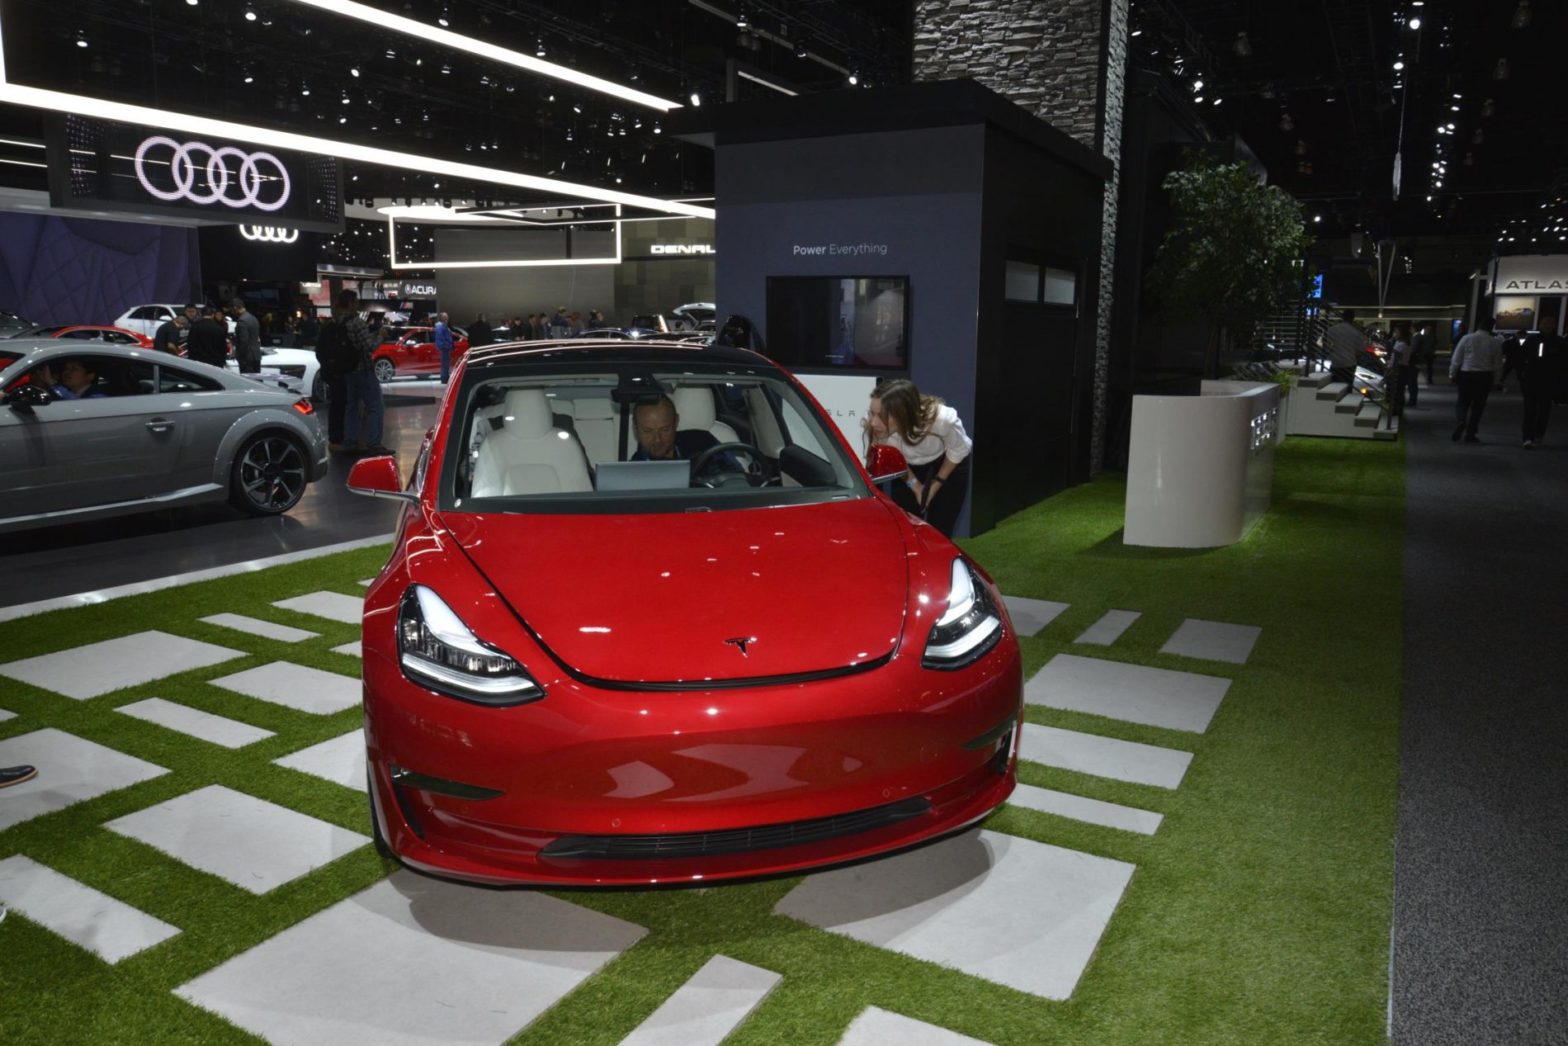
While Tesla Model 3 sales didn’t surpass that of September, Model S, X, and other automakers’ sales rise up to elevate November.
Based on automakers’ sales reports and our estimates, we report a total of 44,148 plug-in electric vehicles were sold in the U.S. in November, compared to last year’s 17,178 and last month’s 34,094. While it wasn’t the best month of all time, it only missed by a hair.
We didn’t really expect that the second month of the quarter would post such incredible numbers, especially with Model 3 sales at an estimated 3,600 units lower than September’s all-time high. As it turns out, Tesla sold a slew of Model S and Model X vehicles (likely due to the expiration of the U.S. federal EV tax credit). In addition, automaker’s like GM, Ford, and even FCA made compelling progress.
Five out of five months in 2018 have claimed a spot on our list of top months of all time for U.S. EV sales. In fact, the last five months are also the top five months, albeit not in calendar order. While we know full well that Tesla is the most substantial contributor to this new trend, numbers wouldn’t be where they are today without the respectable sales of the Toyota Prius Prime, Chevrolet Volt, Chevrolet Bolt EV, Honda Clarity Plug-In Hybrid, and Nissan LEAF. In November, the Ford Fusion Energi, BMW 530e, and Chrysler Pacifica Hybrid also posted notable sales figures.
Top Months for U.S. EV Sales to Date (estimated):
- September 2018 – 44,589
- November 2018 – 44,148
- August 2018 – 36,380
- October 2018 – 34,094
- July 2018 – 29,514
The Tesla Model 3 tops our chart by leaps and bounds, with 114,532 estimated U.S. deliveries. This makes it 11 months in a row that the Model 3 has been the U.S. EV sales leader. We estimate Tesla sold some 18,650 Model 3s in the month of November.
Model S and Model X sales were up significantly in November, though the vehicles remain in the 3rd and 4th positions on the year, respectively. Overall, Tesla delivered an estimated 24,600 vehicles last month, which adds up to well over half of all EVs sold in the U.S. in November. Based on our estimates – for the year as a whole – Tesla has sold a whopping 159,027 vehicles in the U.S. out of a total of some ~312,877 overall EV sales to date. The automaker now officially accounts for over half of all electric vehicles sold in the U.S. for 2018.
Let’s take a closer look at the other top-selling electric vehicles in the U.S. this November:
The Toyota Prius Prime lands in the six-spot for the month and the second-place position for the year as a whole, with 2,312 deliveries in the U.S. in November.
The Chevrolet Volt surpasses the Chevrolet Bolt EV once again, after falling behind its stablemate in October. In addition, it remains ahead of the Bolt by over some 1,700 units for the year as a whole. Based on our estimates, the Volt lands in the second-place position for November, (3,930) and remains in the fifth position for the year thus far. Still, our research shows that Chevrolet Bolt sales were up considerably in November, at 3,025, slotting it in the four-spot on the month and maintaining its sixth place position for 2018 as a whole.
The Honda Clarity PHEV, Ford Fusion Energi, Nissan LEAF, and BMW 530e all sold over 1,000 copies in November as well. The Clarity PHEV sits in sixth place on the year, followed by the LEAF, 5 Series, and Fusion, respectively.
We’ll close out the month with the usual final data points and another look at our completed sales chart.
Other Statistical Points of Interest from November 2018
Top Manufacturers Of Plug-In Vehicles:
- Tesla* – 24,600
- General Motors* – 6,968
- BMW Group – 2,314
- Toyota – 2,312
- Honda – 1.903
- Ford – 1.132
- Nissan – 1,128
Pure Electric Car Market Share vs PHEV In November*
- BEV – 29,819
- PHEV – 14,329
*Based on estimates due to the lack of U.S. monthly sales reporting by Tesla and GM, as well as BMW i3 splits (BEV + REx), and multiple automakers refusing to reach out or reply related to individual EV sales.
 Above – 2018 Monthly Sales Chart For The Major Plug-In Automakers. *Estimated Sales Numbers – Reconciled on Monthly or Quarterly Totals. ** Estimated (Based on State/Rebate Data and other reports). BEV models are designated with the icon.
This article originally appeared on Inside EVs.
