Welcome to Tesla Motors Club
Discuss Tesla's Model S, Model 3, Model X, Model Y, Cybertruck, Roadster and More.
Register

MASTER THREAD: 2021 Model 3 - Charge data, battery discussion etc

This site may earn commission on affiliate links.
@AlanSubie4Life[/USER]
The screenshot you asked for calcultaing the constant /battery size

LR 2021 EU with 18"
VIN 815xxx, Update 2020.44.25
E5D - old headlights
Parked in a garage, Temp. 13°C; Mileage = 225 km
WLTP 580 km - 148 Wh/km
Rated on car @100% = 534 km (332 mi) , a 7% increase from previous EU model.

For reference:
EU 2019-2020 with 18"
WLTP 560 km
Rated on car @100% = 499 km (310 mi)
No upgrade or new omologation when US went to 322 mi (fake increase?), AFAIK.

Unfortunately, the update 2020.44.25 is giving me various problems, and one is it changes randomly the selection of Energy/distance and the lock on the door on exit, for example. It doesn't retain in memory the selection. So, when i changed to distance in km, it changed in the meantime and i've got to pics at 100%. At the moment i didn't realized it.

So i've been forced to go back some minute later to take another pic and the range went down of 2 kms.

Never mind, the right values are 534 km rated and 473 km projected range at 157 Wh/km.

I can add that other 2021 LR EU are getting the same value, and this is the same of the guy of the other thread.

But i doubt is a net 71 kWh, explain me better that hidden 4,5% story. Where comes from @AlanSubie4Life
 

Attachments

  • 1607254662733.jpg
    1607254662733.jpg
    139.4 KB · Views: 6,561
  • 1607253336929.jpg
    1607253336929.jpg
    290.8 KB · Views: 926
  • 1607253336936.jpg
    1607253336936.jpg
    193.9 KB · Views: 878
  • 1607254617456.jpg
    1607254617456.jpg
    277.6 KB · Views: 897
Last edited:
The closest I got was 99 %.

Here are my results:

LR 2021 EU with 18"
VIN 818xxx, Update 2020.44.25
E5D - old headlights
Parked outside, Temp. 7°C; Mileage = 1.000 km
WLTP 580 km - 148 Wh/km
Rated on car @ 99% = 527 km (328 mi)

In other words pretty much the same as OP/EV Promotor.
 

Attachments

  • E5715218-BE8E-4314-8100-FEE11E6086F7.jpeg
    E5715218-BE8E-4314-8100-FEE11E6086F7.jpeg
    656.4 KB · Views: 802
  • 44C3D02C-2961-4C45-BA1B-CB4295689C36.jpeg
    44C3D02C-2961-4C45-BA1B-CB4295689C36.jpeg
    794.7 KB · Views: 723
  • 5309ED94-CA51-4EC2-980F-5E1F02C4DC9E.jpeg
    5309ED94-CA51-4EC2-980F-5E1F02C4DC9E.jpeg
    696 KB · Views: 664
Last edited:
  • Like
Reactions: AlanSubie4Life
Thanks! Thanks in particular for all the environment conditions and other details.

As you have said, your 100% capacity is:

474Wh/km*157km = 74.3kWh

Your vehicle constant (as in the other thread) is:

EU Model 3 AWD (non-P) 18”:

139Wh/rkm
224Wh/rmi

Hidden 4.5%:

When your battery shows 0 rated km remaining, you have about 4.5% of your full pack energy left. Just because of the way these screens work (there’s no way to just know this, it is just from experience and comparing to ScanMyTesla or whatever), that 4.5% is part of that 74.3kWh - it is not “in addition to”.

So, available above 0 rated km is:

0.955*74.25kWh = 70.9kWh


So, I do wonder if in the next month or two Tesla will unlock some capacity. I do not know why the battery capacities are so low. Anyway. We have this data point, which is great. Now, if anything changes, we will see it.

I suspect if they do unlock some capacity the constant will remain the same and the capacity will be increased (a direct and real range increase). But it is also possible both will change. We’ll be able to determine that too, at that time.

If they do unlock capacity, we’ll never know what your battery “would have” started at. Because your battery is now in the process of losing capacity, and even if it is just in a few weeks, the unlock will likely not yield the same max energy as it would have if you had had it from the beginning.

It depends, though! Depends on what they set the “degradation threshold” to (the energy value where you start to see a reduction in rated miles at 100% charge). If that is below your current battery capacity we will see the new max value.

Anyway, this brings up another point: I think that 74.3kWh above represents the minimum energy in your pack. It may actually be higher (depends on that degradation threshold setting!). The only ways we can know are:
1) get more data from others and see whether someone ends up with a higher energy value at 100% for the same type of vehicle. That would imply your energy is below the threshold.
2) Get SMT or similar and gather data. It will show the actual data.
3) Carefully measure use on the trip meter and battery gauge and extrapolate. This is prone to many sources of error though, so is difficult to do, unless you do a very careful uninterrupted drive with good data gathering and drive from 100% to 10% or so. Trip meter is renowned for losing track of energy; that is its main purpose as far as I can tell. (Procedure: drive a distance, very very carefully measure rated miles/km used, only while in drive, minimizing rounding error. Then compare to the trip meter value “since x:xx”. Calculate Wh/km * km / (rated km used). See whether it is 0.955*139Wh/km *0.99 = 131Wh/km. If it is higher you may be above the threshold.)

If you are already below the degradation threshold, the 74.3kWh is your actual pack energy. You can’t get any more.

You’ll have circumstantial evidence you are already below the threshold if you immediately start losing rated range at 100%. If you stay at your 534km at 100% when you charge to 100%, for a couple months, that implies that originally you actually had more than 74.3kWh. As far as we know, the way they manage this is by expanding the energy content of each rated km when you are above the threshold. Once you drop below the threshold you’ll be at the 139Wh/km calculated. That’s why observing the trip meter carefully can shed light on this.
 
Last edited:
The closest I got was 99 %.

Here are my results:

LR 2021 EU with 18"
VIN 818xxx, Update 2020.44.25
E5D - old headlights
Parked outside, Temp. 7°C; Mileage = 1.000 km
WLTP 580 km - 148 Wh/km
Rated on car @ 99% = 527 km (328 mi)

In other words pretty much the same as OP/EV Promotor.

Yes. You are very close. It may be that you are lower than 534rkm but hard to tell without a true 100% (which can take a long time). If you are at 534km as well that suggests that is the degradation threshold (74.3kWh), at least for now.

If either of you happen to do a reasonably long drive (continuous no stops), something like 50 miles or more, and you happen to be able to gather the precise info (rated km at start (right as you leave park) and at end (right as you enter park), and a picture of the precise “since x:xx” data), that would be helpful.

1) Starting rated miles/km (km better)
2) Ending rated miles (km).
3) Since x:xx. Wh/mi and distance traveled. Since last charge is not useful.

Again this is fraught with imprecision. Can’t have any stops. Can’t have temp changes. Needs to be a longish trip. But it is something. I expect a result of about 131Wh/rkm.

Won’t tell us much except whether or not either of you have more capacity than shown.
 
Last edited:
If either of you happen to do a reasonably long drive (continuous no stops), something like 50 miles or more, and you happen to be able to gather the precise info (rated km at start (right as you leave park) and at end (right as you enter park), and a picture of the precise “since x:xx” data), that would be helpful.

1) Starting rated miles/km (km better)
2) Ending rated miles (km).
3) Since x:xx. Wh/mi and distance traveled. Since last charge is not useful.
On tuesday i'll do a 34 mi non stop drive with highway (about 1 PM), and back (about 8 PM), i'll collect the data anyway.

In the meantime i have the less useful data of this afternoon since i charged to 100% - 12AM to 6 PM, some few stops, some half hour in the car showing things and farts to friends, etc... which is nonetheless useful to me to understand AVE FE.

113 kms for the day, at 142 Wh/km average (driving) including 50 kms at 95 km/h on freeway, some rain, wet road, 20° climate.

Not bad, very happy. If you can get anything useful please.

But @AlanSubie4Life clarify one thing: the 534 km, are related to the 71 kWh @139 Wh/km?

1607279455189.jpg
1607279455193.jpg
 
Last edited:
Here’s my 2021 Model 3 LR:

18” wheels
VIN 8368xx
Software 2020.39.103
Parked in a garage at 57.2F
100% charge (waited until it stopped charging)
207 miles on the odometer
Build date 11/24/2020

346 miles / 557 km displayed range

I gotta hit the road, so I’ll let @AlanSubie4Life or someone else do the math. :)

As bonus, I included a Teslamate graph of the projected range over the course of my last charge (from 82% to 100%)...getting to 100% didn’t make it recalculate anything. It varied from 344 to 348 mi, with the variance and sawtooth pattern just being due to rounding.

I should have a nice Teslamate graph of charging rate from my first supercharging attempt sometime tonight!
 

Attachments

  • 37601E0A-907D-4C44-9E47-EC562CE922A7.jpeg
    37601E0A-907D-4C44-9E47-EC562CE922A7.jpeg
    624 KB · Views: 609
  • A2A1A642-AA4F-4101-B7C0-FBDA4EE9B6EA.jpeg
    A2A1A642-AA4F-4101-B7C0-FBDA4EE9B6EA.jpeg
    594.9 KB · Views: 576
  • 8F26D537-F694-4D7C-A22E-0738B46D0D80.jpeg
    8F26D537-F694-4D7C-A22E-0738B46D0D80.jpeg
    462.6 KB · Views: 523
  • 754A8597-ECF6-4AF3-8C90-9B73BF3852A0.jpeg
    754A8597-ECF6-4AF3-8C90-9B73BF3852A0.jpeg
    414 KB · Views: 483
  • 05836719-5BF7-4348-AEB3-AC7E44198843.jpeg
    05836719-5BF7-4348-AEB3-AC7E44198843.jpeg
    112.8 KB · Views: 663
Here’s my 2021 Model 3 LR:

18” wheels
VIN 8368xx
Software 2020.39.103
Parked in a garage at 57.2F
100% charge (waited until it stopped charging)
207 miles on the odometer
Build date 11/24/2020

346 miles / 557 km displayed range

I gotta hit the road, so I’ll let @AlanSubie4Life or someone else do the math. :)

As bonus, I included a Teslamate graph of the projected range over the course of my last charge (from 82% to 100%)...getting to 100% didn’t make it recalculate anything. It varied from 344 to 348 mi, with the variance and sawtooth pattern just being due to rounding.

I should have a nice Teslamate graph of charging rate from my first supercharging attempt sometime tonight!

Very informative.

Your full battery capacity is 77.4kWh (multiply recent efficiency Wh/mi by projected range at 100% condition).

The charging constant is 224Wh/rmi, or 139Wh/km. (Divide energy by the number of rated miles or km.)


It's interesting - this is the same constant as the European vehicles, but you have more capacity. I don't really know why this would be at this point.

It's also interesting that (so far) you do not see the 353 rated miles. There are three possible reasons for this (it may be that none are the case):

1) Your battery has lower capacity than most, and 79kWh is required to show 353 rated miles. We'll determine this if more people report this exact same data. Not all packs start at the same 100% value - though 1.6kWh below the degradation threshold would be quite bad. (For reference, 2020 vehicles had ~77.6kWh as the degradation threshold.)

2) Tesla hasn't got the constant set correctly yet (software). I expected a constant of 220Wh/rmi. Preliminary EPA Data for Model 3 AWD & Model 3 P 2021 Released With that 220Wh/rmi constant your car would show 352 rated miles. There is precedent for this - nearly exactly a year ago, new 2020 vehicles were showing low range for this reason. The website shows an EPA range of 353 rated miles, so I do expect that a brand new vehicle will show that, eventually.

3) Some other lockout reason, or other reason. (Honestly I had another idea in mind, but I forgot what it was, lol.)


These are great pictures to have captured, because if there is a software update that changes the constant, or they unlock some of your capacity, or whatever, we'll be able to see it when it happens - the implied constant in these pictures will change (in general this is very rare for Tesla to do - it's called a constant for a reason - but it can happen at the very beginning of a new model vehicle rollout).

Also, coming full circle on this, remember that this data means that you need to get about 0.955*0.99*224Wh/mi = 212Wh/mi to get "mile for rated mile" rolloff on the rated miles, when comparing to the trip meter (could call it the trip meter "constant" though it has some variability). That's because of the 4.5% buffer and a little bit (~1%) of heat loss/inaccuracy on the trip meter. Note that there is variability on the trip meter - range can go up and down due to temp changes, balancing, etc., so you'll never be able to get such trip meter calculations to align as consistently as the energy consumption screen.

In short, travel at 212Wh/mi, if you want to make your rated range, and not use any of the buffer.
 
Last edited:
Your full battery capacity is 77.4kWh (multiply recent efficiency Wh/mi by projected range at 100% condition).

The charging constant is 224Wh/rmi, or 139Wh/km. (Divide energy by the number of rated miles or km.)

It's interesting - this is the same constant as the European vehicles, but you have more capacity. I don't really know why this would be at this point.

Alan, in your other thread you wrote:

3) Taking these factors together, for the same battery capacity as prior years, AWD (non-P) would have about 335 rated miles range, vs. prior year 322 (4% improvement).
4) The additional 18 miles range improvement, taking it to projected 353-mile range on the website, is from the scalar increase (due to the heat pump). The scalar looks like it will be about 0.746.

Now, why those differences can't come from the scalar taken from 0,70x to 0.746 in US and not in EU?

How can you extrapolate different battery size not taking in account the scalar? Clearly a different scalar will give you seemingly different capacity, or i'm missing something?
 
Now, why those differences can't come from the scalar taken from 0,70x to 0.746 in US and not in EU?

How can you extrapolate different battery size not taking in account the scalar? Clearly a different scalar will give you seemingly different capacity, or i'm missing something?

The scalar is just an EPA construct. It's what you multiply the dyno ranges by to get the EPA range number. It does not affect capacity. (It's (0.55*UDDS+0.45*HwyFET)*scalar.)

Scalar is not to be confused with the constant (not sure if you were, but just want to make sure to be clear we're talking about totally different things here). The constant is the same for both vehicles (EU and US), see above.

For battery capacity: I look at the EPA results. I have no idea what the European numbers are. But the EPA result was that they drew ~78.5kWh from the AWD battery, and around ~81kWh from the Performance battery. So we know already what the approximate battery capacity is (in the US, once the software is finalized and released).

However, these numbers are slightly different than what it reported by SMT, and similar tools. (Typically they are higher than the SMT value. Probably because they are not counting the same kWh, or kWh is scaled differently, or there is a little bit of energy available BELOW the buffer which isn't counted before the car comes to a complete halt - I have no idea actually.)

The constant (not the scalar) can be whatever, it won't change capacity. It just changes the displayed range, and is used to make it match the EPA value when new. As I said, the EPA scalar also has zero impact on capacity; it has no dependence or relationship to capacity at all - it is just the ratio of EPA range to weighted dyno range.

I'm not sure whether this answers your question. Feel free to ask differently and maybe I can understand better what you are asking.
 
Last edited:
There are simply two variants of the battery. One the smaller one 74kWh net LG and the 77kWh, This is why we have some cars with 535 and some cars with 550-555km in Europe.
The constant for these calculations is the same 139Wh/km.
 
There are simply two variants of the battery. One the smaller one 74kWh net LG and the 77kWh, This is why we have some cars with 535 and some cars with 550-555km in Europe.

The question is whether they will remain that way (seems possible they will remain different, asked on the available documentation on capacities, though I don't have the whole picture). It also means that LG batteries are not going to come to the US (unless the full capacity is unlocked somehow), otherwise they would have to do another EPA test and quote a different range.

We need data from a European AWD (non-P) with the other battery variant! Presumably it would match the US variant.

Do you have any idea what determines which battery goes in which car? It seems a bit strange to have two different capacity batteries on a permanent basis for the SAME trim level, without any choice by the consumer in which one they get. (That's why I wonder whether they will eventually be aligned and this is Tesla being conservative about charge level or depth of discharge of cells from a new vendor, for now.)
 
@AlanSubie4Life
You wrote, and i've quoted, that the 353mi comes only from a scalar increase from 0,7 to 0,746. Otherwise would have been 335 mi.

Now, both the rated 100% and the projected range have to use the same scalar. I'm not talking of the constant, of course.

So, if the 353 mi is an an artifact, according to you and EPA data, and should be reduced of 0.7/0.746, same fate and coefficient should be applied on the projected 475 km shown by the US car.

It seems you are assuming the projected range is unrelated to the rated range, in my view, this is unjustified unless you know how Tesla calculate the Energy App numbers.

Don't worry about the german papers showing 2 (3 actually) different batteries, the same germans of the forum put in question such an interpretation : a good argument (this not clarified yet) is the 2 construction code E3D & E5D, unexplained in their essence.

They for sure belongs to 2 batches of homologation, source of possible changes on how were calculated the capacity, a non-technical but bureaucratic issue.

Afaik, in EU no hard evidence of anything different of the 535 km at 100% appeared at this date, so it's still unjustified to think of 2 different batteries.
 
  • Informative
Reactions: AlanSubie4Life
You wrote, and i've quoted, that the 353mi comes only from a scalar increase from 0,7 to 0,746. Otherwise would have been 335 mi.

That's basically correct. For the dyno test, they got 494.54 miles on the city test, and 446.78 miles on the highway test. For a weighted average of 473 miles in the test.

Even if they had not had the heat pump, simplistically they would have got about these same basic range numbers, since they do not use climate control to get them. In any case the scalar has no impact on these numbers - they're from the dyno! It is determined by vehicle efficiency and the battery capacity. It does not impact how far the vehicle goes.

However, they used the heat pump to get better results on the cold cycle (FTP 20F) and hot cycle (SC03). These results play into the scalar, and Tesla choses to run a complex 5-cycle calculation (not that complex, just has a lot of numbers in it) from the EPA to come up with 0.746. Rather than 0.7 (which is the default value that most manufacturers use, even if they use heat pumps).

0.746*473miles = 353miles. (0.7032*473 = 333 rated miles - close enough to 335 - not sure why I said 335 tbh. Tiny difference. 0.7032 is the old scalar.)

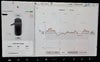
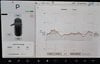
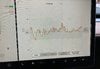
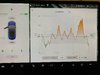
Here's the scalar calculation for the SR 2020 (which ended up at 0.7055 because no heat pump), as an example. For the Model 3 AWD this year it ends up at 0.746.

Screen Shot 2020-12-06 at 9.01.53 PM.png


So, if the 353 mi is an an artifact,

It's not an artifact. It is calculated as explained above. It's directly related to the vehicle efficiency, and the battery capacity (and it is a function of all 5 test cycles (via the scalar), not just two cycles).

It seems you are assuming the projected range is unrelated to the rated range, in my view, this is unjustified unless you know how Tesla calculate the Energy App numbers.

I'm not assuming projected range is unrelated to the rated range. It's directly related, via a formula explained above (and also below).

There are some assumptions here: Namely, we are assuming it works the same as it always has for Tesla. In past years after deduction and painstaking data collection, we know how Tesla calculates the Energy App numbers. And we've been able to confirm the results with SMT read backs, etc. You'll have to take my word for now it that it works this way, but you can also verify it yourself with no special tools at all. (No SMT or similar.)

For my car, 2018 Performance, the charging constant is 245 Wh/rmi. This is what you get if you are supercharging (or charging) and you divide energy added by miles added in a session. Always. That's why it's called the charging constant. You'll see it too. Except you'll get 224Wh/mi.

It turns out this value is used in the Energy App as explained already with formulas:

Projected Range = (Rated Range Remaining * Charging Constant) / Recent Efficiency

Subtle point: (Rated Range Remaining * Charging Constant) is ONLY correct to use for "Energy Remaining" at 100%. For example, at 50% on the battery gauge, you don't have half your energy left. You have 0.955*FullPackEnergy*0.5 + 0.045*FullPackEnergy = 0.5225*FullPackEnergy left (52.25%). Which is not half of FullPackEnergy. And at 0 rated miles/km, rather than 0, you have 4.5% left.

Subtle point 2: Also implies that the charging screen "energy added" is incorrect. We know that actual available energy added is 0.955*Charging Constant per mile added. This has been confirmed with SMT. And it's also required for conservation of energy. But it's something to keep in mind. And no, it is not correct after you include charging losses on the DC side of the charger, either. (That's far too high (4.5%!), and the amount of DC energy loss during a charging cycle is also called out in the EPA documents for a full charge from empty to full. And it's ~1.5kWh, closer to 1.7%. And that has nothing to do with this discrepancy anyway.). AC to DC losses of course are much higher than this (9.9% in the EPA test condition) but that's a totally different topic.

Aside, please ignore this:
You can see from the statements above that this calculation really isn't right at all. But it is what it is, as they like to say. I'm not going to go into the adjustments I would make to make it right, but it doesn't matter. No one uses this to estimate range anyway - they use the Trip Planner which works differently as far as I can tell. And it's close enough, and only gets more pessimistic (with respect to 0 pack energy left, including the buffer) as you get lower in energy. Which is what you want.

Beyond that, the "way it works" and the buffer capacity are confirmed by SMT, and through observation of the trip meter behavior being 4.5% lower "Wh/rmi" than the charging constant. So I see 230-234 Wh/rmi when observing the trip meter. On every single decent length trip, no matter whether my consumption is 150Wh/mi or 450Wh/mi. SMT is not strictly needed - it can all be deduced from observation of the trip meter. But SMT confirms it.

So, if you wonder about what I'm saying, just observe it carefully yourself. Trip meter and the battery gauge (in km!) is all you need. You don't have to believe me.

Afaik, in EU no hard evidence of anything different of the 535 km at 100% appeared at this date, so it's still unjustified to think of 2 different batteries.

@TimothyHW3 has stated differently. Perhaps he could post data from an EU car with the higher rated range.
 
Last edited:
  • Informative
Reactions: EV Promoter
Very informative.

Your full battery capacity is 77.4kWh (multiply recent efficiency Wh/mi by projected range at 100% condition).

The charging constant is 224Wh/rmi, or 139Wh/km. (Divide energy by the number of rated miles or km.)

These are great pictures to have captured, because if there is a software update that changes the constant, or they unlock some of your capacity, or whatever, we'll be able to see it when it happens - the implied constant in these pictures will change (in general this is very rare for Tesla to do - it's called a constant for a reason - but it can happen at the very beginning of a new model vehicle rollout).

Interesting! I just finished my road trip and ran the numbers again...currently showing 158 Wh/km and 356 km projected range at 72%, which translates to 78.1kW (range of 77.3 - 79.0 when accounting for the unrounded ranges of 157.5 - 158.4 Wh/km, 355.5 - 356.4 km, and 71.5 - 72.4% charge.) The two calculated values overlap so maybe it’s just rounding, but maybe my car did recalculate something after the long trip. I’ll be curious to see what happens when I get a software update.

As far as the road trip itself, I was quite satisfied with the range! I made it from Portland to Sisters (actually halfway between Sisters and Bend, so a few more miles) with 41%, which is exactly what the nav system predicted. Then I made it from Sisters to the supercharger in Salem with 12% left, after a starting prediction of 11%. I could’ve actually made it to the supercharger in Woodburn with 6% or so, but that was too risky and I wanted to try out 250kW charging. Total distance was 278 miles for that 88% of charge, so 316 miles of range extrapolated to 100%.

Average speed was about 52mph (lots of slow traffic in the mountains...also Teslamate broke the drive into segments and dropped about 20 miles of data so it’s a little hard to calculate exactly.) Average temp was about 45F...it got down to 34F in the mountains on the way back. Road was a little wet at times but no actual rain, and I kept the heat at 68F. Given the mountainous terrain (it gets up to 4800’ along the way) and cold weather, this seems pretty reasonable. It looks like the heat pump did make a significant difference here. ABRP shows that a 2020 Model 3 would have had to stop in Detroit on the way back rather than safely making it to Salem.

Finally, I managed to supercharge from 12% to 90% on a 250kW charger in Salem. My peak was only 184kW...I’m wondering if my battery just wasn’t warm enough. It was preheating for about 15 mins before supercharging, but I was only driving about 65 - 70 at the beginning of that, then on local roads for 5 minutes to get to the supercharger. Teslamate graph of my session is attached. It looks similar to the Panasonic curve (from the graph @TimothyHW3 linked: http://img.suv666.com/mcn/news/article/b200b7293ea33f60aaf1b06101a0f6d5.jpeg-690x) other than the lower starting peak. I didn’t drop below 100kW until 56% SoC, whereas the LG battery drops below that around 35% (crossover pointed is highlighted with the vertical red line in my screenshot.)

So based on all this data, it sounds like I have a Panasonic battery of either 77 or 82kWh. I still need to pick up a socket wrench and disassemble my frunk...probably will not get to that until next weekend though.

Edit: also, we can confirm the charging constant of ~224 Wh/rmi from the supercharging session data. 271.15 miles of range added for 60.7kWh == 223.9.

65D85A22-131F-4C2F-9BEB-48FF04976BB5.jpeg
 
Last edited:
My peak was only 184kW...I’m wondering if my battery just wasn’t warm enough. It was preheating for about 15 mins before supercharging, but I was only driving about 65 - 70 at the beginning of that, then on local roads for 5 minutes to get to the supercharger.
Your battery was too cold to get near 250kW. It'll get above 200 kW in the summer. It was acting normal for having been preheated in winter.
So based on all this data, it sounds like I have a Panasonic battery of either 77 or 82kWh.
Not enough data to make that conclusion. Definitely don't use a single Supercharging experience to make that determination. The Supercharging profile of the Panasonic battery has not been adequately characterized.
 
  • Like
Reactions: AlanSubie4Life