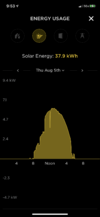
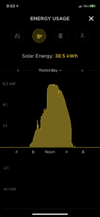
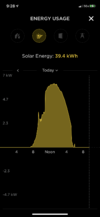
Those numbers seem reasonable to me. I'm in San Diego with an 8.16kW system with a Tesla inverter, estimated to produce 12,921kWh a year. I have 10 panels facing SE and 14 facing SW. My summer production (on clear days) typically falls between 45 kWh and 51 kWh and I have never seen peak production exceed 6.8 kW (it typically falls between 6.5 kW and 6.7 kW).
Keep in mind that most homes have panels on different roof planes, so peak production on one plane (from the sun angle) may not align with the other plane's peak production time. As an example, if all of my 24 panels were on one plane, I would expect a higher peak production amount in the middle of the day, but a steeper bell curve when looking at solar generation. In other words, with my SE and SW layout, I get better production earlier and later in the day, but my bell curve should be a little more flat in the middle of the day (also showing a lower peak production rate). I prefer to have the SW panels because it generates more energy back to the grid during peak rates for NEM (after 4 pm for summers).
For the reason mentioned above, I would suggest you focus on total daily production and compare to the PV Watts calculator. For my home, PV Watts is calculating my June, July and August production to be about 1,300 kWh a month and my actual generation was 1,362 kWh in June and 1,366 in July.