I just charged my 60kWh S from ~23% to 100% while recording the CAN bus messages off bus #3 (which has power train and battery information). What might be interesting to look at? Everything is tagged with a 1ms resolution time stamp (just the one you get from the Arduino millis() function that starts at 0 at power on). So far I've poked around looking at the state of charge and the voltage of the individual groups of cells, but as there are 24 of the latter, plotting the data gets to be quite messy.


Welcome to Tesla Motors Club
Discuss Tesla's Model S, Model 3, Model X, Model Y, Cybertruck, Roadster and More.
Register
Install the app
How to install the app on iOS
You can install our site as a web app on your iOS device by utilizing the Add to Home Screen feature in Safari. Please see this thread for more details on this.
Note: This feature may not be available in some browsers.
-
Want to remove ads? Register an account and login to see fewer ads, and become a Supporting Member to remove almost all ads.
You are using an out of date browser. It may not display this or other websites correctly.
You should upgrade or use an alternative browser.
You should upgrade or use an alternative browser.
glhs272
Unnamed plug faced villian
4.3 volts at 100% SOC? That seems high. I would expect 4.2 volts per cell max. I wonder if there is an offset or an error in your CAN decoding.
DB 2
Member
No, didn't even think about that, unfortunately.Did you continue recording after the charge ended? What was the voltage 30 minutes after?
Given DB 2's post, is it possible the 4.3 volts is actually measuring the charge voltage rather than the open circuit battery voltage? This seems pretty likely, actually. It looks like the update rate for the cell cluster voltage messages is ~200s and I'm pretty sure I did not wait that long after the charging completed before stopping the data capture.4.3 volts at 100% SOC? That seems high. I would expect 4.2 volts per cell max. I wonder if there is an offset or an error in your CAN decoding.
glhs272
Unnamed plug faced villian
I would say no, but I could be wrong.
When charging near 100%SOC, this is the constant voltage phase of charging. This is when the charger is holding a specific voltage and as the cells charge up and their theoretical open circuit voltage approaches the charging voltage, the current goes to zero. Therefore at 100%SOC, the cell's open circuit voltage is very close to the charge voltage (but not exactly because the is also a current cut-off point when charging). With typical Panasonic lithium ion 18650 cells, 4.20 volts is the maximum charge voltage with a 100mA cut-off. For example, see this datasheet: https://industrial.panasonic.com/cdbs/www-data/pdf2/ACA4000/ACA4000C50.pdf
Another way to check this would to to look at the supercharger data. When I supercharge my car, I never see much beyond 352-353 volts at 100%SOC. 352.8volts/84cells in series = 4.20 volts.
All that said, this could change in the future with new chemistry and new additives in future cells. I believe Tesla has made some breakthroughs in cell additives that allows them to raise the 100%SOC safe voltage. But the old 60 and 85kwh batteries in the 2012-2015 vintage model S use older Panasonic chemistry similar to the one I posted.
glhs272
Unnamed plug faced villian
I took a quick look at WK057's Can bus Deciphering document Version 0.1. If this is what you are using to decode, you are correct that he doesn't mention an offset for Bytes 1/0 on Can Frame ID 0x0102. But he does mention that he had a limited data set to work from, perhaps the 60kwh cars have an offset. Could you post an example CAN frame?
"Classic" 60. Single motor.Is this a classic 60 or a modern 60 (limited 75)?
glhs272
Unnamed plug faced villian
Well, c4 8c does come to 36036. However, I still don't think it's correct. I suspect there is a -1000 offset, however until I sniff the CAN bus on my car, I can't be sure. Have you observed the pack voltage while supercharging? Does it correspond to what you are seeing on the CAN bus?
No data from supercharging. I probably won't have a chance to get data like that, either - I'm only going to have this 60 til the end of the month and the nearest supercharger is an hour away. What's more, I can probably count on one hand the number of times I've charged this car to 100%, so any other data I have probably would not be useful.
glhs272
Unnamed plug faced villian
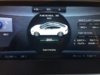
Ok, I can try again tomorrow to 80% using the HPWC and compare the CAN data with the UI. We all know the UI doesn't show the real data thoughOK. Looking at this picture, this is why I am skeptical of your CAD data calculation. Notice 351 volts at 100%SOC. I am thinking there must be differences in the way the 60 cars report battery data on the CAN bus versus the 85 cars.
")
glhs272
Unnamed plug faced villian
Unless you can get into the Diagnostics screens, the car will not report pack voltages while charging from an AC connection. Only DC fast charging from a supercharger or Chademo charger shows pack voltage, and only on older firmware (anything prior to FW8.0).
Unless you can get into the Diagnostics screens, the car will not report pack voltages while charging from an AC connection. Only DC fast charging from a supercharger or Chademo charger shows pack voltage, and only on older firmware (anything prior to FW8.0).
Some third party phone apps still report Voltage during DCFC including Supercharging - Remote S is one that does.
glhs272
Unnamed plug faced villian
Ok. I don't use Remote S or newer firmware, but good to know.Some third party phone apps still report Voltage during DCFC including Supercharging - Remote S is one that does.
Unless you can get into the Diagnostics screens, the car will not report pack voltages while charging from an AC connection. Only DC fast charging from a supercharger or Chademo charger shows pack voltage, and only on older firmware (anything prior to FW8.0).
Another stupid 8.0 regression...
Unless you can get into the Diagnostics screens, the car will not report pack voltages while charging from an AC connection. Only DC fast charging from a supercharger or Chademo charger shows pack voltage, and only on older firmware (anything prior to FW8.0).
that sucks. Honestly that's the sort of data I'd be most interested in seeing, after SOC%Similar threads
- Replies
- 2
- Views
- 1K
- Replies
- 12
- Views
- 2K
- Replies
- 25
- Views
- 10K