


Welcome to Tesla Motors Club
Discuss Tesla's Model S, Model 3, Model X, Model Y, Cybertruck, Roadster and More.
Register
Install the app
How to install the app on iOS
You can install our site as a web app on your iOS device by utilizing the Add to Home Screen feature in Safari. Please see this thread for more details on this.
Note: This feature may not be available in some browsers.
-
Want to remove ads? Register an account and login to see fewer ads, and become a Supporting Member to remove almost all ads.
You are using an out of date browser. It may not display this or other websites correctly.
You should upgrade or use an alternative browser.
You should upgrade or use an alternative browser.
Battery Degradation
- Thread starter Cerebralblue
- Start date
Has anyone seen this type of drop of in their battery health?
I have a Model 3 LR AWD with AP3
Not nearly that steep, but I think I’m going to do a full 100% charge soon just to see where it comes in. Was hoping I’d have the miracle battery but this is well within the realm of normal. Less than 1%. Wondering how much of it is weather related - was holding at a steadier clip until it got cold.
Also, approximately the time my wife started driving it every day ... so maybe that’s it.
")
My goodness, at this rate, in 10 years I’ll only have about 290 miles of range! Whatever shall I do?
Last edited:
You've got no deg or drift. It showed over 310 miles not even 100 miles ago. Don't be fooled by the straight line. It's misleading. Further, as it gets colder out, your car will have more phantom/vampire drain. I've noticed that Stats is anywhere from 1% to 3% or more below what the car says. So, the rated range number starts to show lower. It can show 15 miles lower.Not nearly that steep, but I think I’m going to do a full 100% charge soon just to see where it comes in. Was hoping I’d have the miracle battery but this is well within the realm of normal. Less than 1%. Wondering how much of it is weather related - was holding at a steadier clip until it got cold.
Also, approximately the time my wife started driving it every day ... so maybe that’s it.
My goodness, at this rate, in 10 years I’ll only have about 290 miles of range! Whatever shall I do?
View attachment 478541
That shows 3 apps, the Tesla app, Stats and EV Watch. You can see Tesla says I have 59% while Stats says 60%. It's always off by at least 1% and sometimes even 5%. That's due to phantom/vampire drain. The Stats SOC %age doesn't seem to update, while the Tesla app does. EV Watch must be pulling the same data as Stats. Obviously, as it gets colder, this difference gets larger. So, when Stats shows an oddly low range estimate, I look at the SOC for the Tesla app and Stats. When you divide Rated Range by the correct SOC %age, my rated range is always normal, but Stats will show a drop. It's all due to the colder temps and phantom/vampire drain.
I told the Stats developer last Winter, he dismissed it, but you can see, the Tesla app matches the car's display, and differs from Stats.
Whatever is your charging routine, give it a change. Change your SOC level by at least 10%. That often corrects BMS drift issues.Has anyone seen this type of drop of in their battery health?
I have a Model 3 LR AWD with AP3
You've got no deg or drift. It showed over 310 miles not even 100 miles ago. Don't be fooled by the straight line. It's misleading. Further, as it gets colder out, your car will have more phantom/vampire drain. I've noticed that Stats is anywhere from 1% to 3% or more below what the car says. So, the rated range number starts to show lower. It can show 15 miles lower.
View attachment 478563
That shows 3 apps, the Tesla app, Stats and EV Watch. You can see Tesla says I have 59% while Stats says 60%. It's always off by at least 1% and sometimes even 5%. That's due to phantom/vampire drain. The Stats SOC %age doesn't seem to update, while the Tesla app does. EV Watch must be pulling the same data as Stats. Obviously, as it gets colder, this difference gets larger. So, when Stats shows an oddly low range estimate, I look at the SOC for the Tesla app and Stats. When you divide Rated Range by the correct SOC %age, my rated range is always normal, but Stats will show a drop. It's all due to the colder temps and phantom/vampire drain.
I told the Stats developer last Winter, he dismissed it, but you can see, the Tesla app matches the car's display, and differs from Stats.
I have also noticed the same issue with Stats Being off by 1% compared to what’s reported in the car and Tesla app. I’m not sure it’s due to phantom/vampire drain...as that wouldn’t/shouldn’t effect what the displayed SOC is. It’s not all the time though. I have also reported it to the developer and didn’t really get anywhere either.
woodguyatl
Member
Has anyone seen this type of drop of in their battery health?
I have a Model 3 LR AWD with AP3
That is 100% normal. Mine and many others exactly the same.
You've got no deg or drift. It showed over 310 miles not even 100 miles ago. Don't be fooled by the straight line. It's misleading.
My apologies if my post wasn’t clear. I’m wholly unconcerned about my battery, at all. I abuse the daylights out of it - horror of horrors, I set my charging to 90% the day I drove it home and left it there. “Managing” the charging percentages is going to be a waste of time.
So far, the Ron Popeil “set it and forget it” strategy seems to be sanest. Then, I just stop worrying about it.
Allistah
Member
I just posted another thread where I asked about the difference between actual degradation and battery imbalance that results in range loss. I think it could be really important understanding the difference so we know if there is anything we can do about it (or not). For example, for battery degradation, there is nothing that can fix that - it is there forever and it is what it is. Now with a battery being out of balance which results in a lower range, I think that can be fixed with some calculated charging routings but exactly what that is seems to be heavily disputed. I'm working on this myself so I'll share whatever I learn (if anything).
Agreed, the Stats developer says the SOC %age comes straight from the API. That's why all the 3rd party apps seem to show the same small error, as they all pull the same figure from the API.I also noticed the 1% difference between what the tesla apps shows and what teslamate (another tracking tool) shows. This may be due to API changes from the tesla's end?
I was trying to figure out how to get a proxy for the difference, and surmised it was the phantom/vampire drain, since when I pull up the Stats phantom drain data, my biggest errors occur when my phantom drain figures are the highest.
In Summer, my drain, as reported by Stats is 0.1miles/hr, better than average. Very low. My Rated Range figures as reported by Stats are all pretty spot on hovering between 306 and 312 miles.
However, when it's cold, Winter, and thru the shoulder months, my drain starts to get quite bad, 0.4miles/hr, worse than average. Some days, 0.8miles/hr. My Rated Range figure on those days can be quite poor, as low as 290 miles. You can literally match the worst drain days with your weirdest Rated Range dots in Stats.
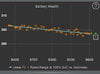
Here's a chart I made in a spreadsheet:
Odometer is on the X-axis, Rated Range on the Y-axis. Red line is 310 miles. Blue line is a Moving Average.
The low estimate dots I have an exact match for from Stats' drain data, I've put in red boxes. As you can see, my chart shows some correlation with the seasons. My lowest Rated Range is during January and February, and starts to improve mid-March. By mid-May I get a range estimate of 314 miles. By mid-November, my Rated Range estimate starts to fluctuate lower, 303 miles on Nov 14. It was brutally cold. Notice those days I have drain matches for, were all high drain days, at 0.8 miles/hr or higher. I've gone to the car, and had the SOC %age show 5% lower than what I set it to charge to at night. During the Summer months, that doesn't happen, only the colder months.
The Stats app shows the same scatterplot, but I made my own spreadsheet, because there was a hiccup early in the year, where I lost all my early data. Luckily I exported some, and had it in a CSV file, so my spreadsheet shows a little more early data than Stats does.
Last edited:
go2realize
Member
Agreed, the Stats developer says the SOC %age comes straight from the API. That's why all the 3rd party apps seem to show the same small error, as they all pull the same figure from the API.
I was trying to figure out how to get a proxy for the difference, and surmised it was the phantom/vampire drain, since when I pull up the Stats phantom drain data, my biggest errors occur when my phantom drain figures are the highest.
In Summer, my drain, as reported by Stats is 0.1miles/hr, better than average. Very low. My Rated Range figures as reported by Stats are all pretty spot on hovering between 306 and 312 miles.
However, when it's cold, Winter, and thru the shoulder months, my drain starts to get quite bad, 0.4miles/hr, worse than average. Some days, 0.8miles/hr. My Rated Range figure on those days can be quite poor, as low as 290 miles. You can literally match the worst drain days with your weirdest Rated Range dots in Stats.
I am not convinced that the difference between the in app battery % and the API parameters reported to the third party is due to the phantom/vampire drain caused by weather changes. I always observed the difference towards the end of the charge cycle, which should not be effected by battery drain. Once the battery is fully charged to X%, that should be reported in both the app and the API parameters. However, if reported API parameters are not accurate, then reverse engineering the underlying cause could be difficult and perhaps your theory of battery drain may explain it.
Has anyone seen this type of drop of in their battery health?
I have a Model 3 LR AWD with AP3
Why yes, yes they have, in the sticky master thread at the top of this forum:
MASTER THREAD: Range Loss, What Can Be Expected, How to Maintain Battery Health
Last edited:
eHaw
Member
Ya agree.Hey it's this thread that totally hasn't been covered 89324 times again
But you know what else wastes time on every thread? Someone pointing out that the topic has been covered elsewhere.
Similar threads
- Replies
- 43
- Views
- 3K
- Replies
- 8
- Views
- 406
- Replies
- 16
- Views
- 3K
- Replies
- 31
- Views
- 2K