To me, any home I see without solar panels on it already looks like something is amiss.This initiative is going to change the dynamics of selling a home that does not have PV. Like a home with only an out-house.


Welcome to Tesla Motors Club
Discuss Tesla's Model S, Model 3, Model X, Model Y, Cybertruck, Roadster and More.
Register
Install the app
How to install the app on iOS
You can install our site as a web app on your iOS device by utilizing the Add to Home Screen feature in Safari. Please see this thread for more details on this.
Note: This feature may not be available in some browsers.
-
Want to remove ads? Register an account and login to see fewer ads, and become a Supporting Member to remove almost all ads.
You are using an out of date browser. It may not display this or other websites correctly.
You should upgrade or use an alternative browser.
You should upgrade or use an alternative browser.
California Renewable Energy Legislation / Progress
- Thread starter RubberToe
- Start date
-
- Tags
- Energy Environment Policy
To me, any home I see without solar panels on it already looks like something is amiss.
Go to Google Earth and punch in Santa Barbara. You must really hate it there. I'm seeing <1:50 solar buildings. My neighborhood is maybe 1:10.
If you looked at my install, you'd see nothing but a warning sign, disconnect, and map if you were very close. You wouldn't see R22 insulation everywhere, 4 high efficiency 480v heat pumps, all 277v LCD lighting, and a 480v rotary air compressor integrated line dryer, and 14 computers with dual monitors, 9 high precision lab machines, with digital temp recorders throughout the lab.
Perhaps I should get some fake solar panel posters printed up and glue them where folk can see them?
Now the Bonus Round!
Home prices average $1.15 million in Santa Barbara. If solar is so good for the working class $300k homes, why don't the rich put them on their houses? Something to think about.
You would think that in California, the Protector of the Poor, we would first demand all homes with an appraised value of over $1,000,000 put $50,000 worth of solar. That's the same 5% as putting $15k solar on a $300,000 home, but the rich can afford it easier.
Last edited:
There is a house on my street with a huge oak tree covering 80% of his panels. WTF?I see someone who probably also bought a time share condo when I seen 10 panels on a residential roof facing east or north.
There is a house on my street with a huge oak tree covering 80% of his panels. WTF?
Good salesman, or change in your building code.
I'm assuming you are quoting the wrong person, because I didn't mention anything about $1 per watt.
No, you have your prices right, someone above said $1/watt plus labor. No way in hell. Your $3 to $4 a watt is what it costs for homes.
mspohr
Well-Known Member
Looks like California green energy legislation is back on the agenda with a changed political environment and a better chance of passage.
California Tries Again With 3 Landmark Clean Energy Bills. This Time Things Are Different
California Tries Again With 3 Landmark Clean Energy Bills. This Time Things Are Different
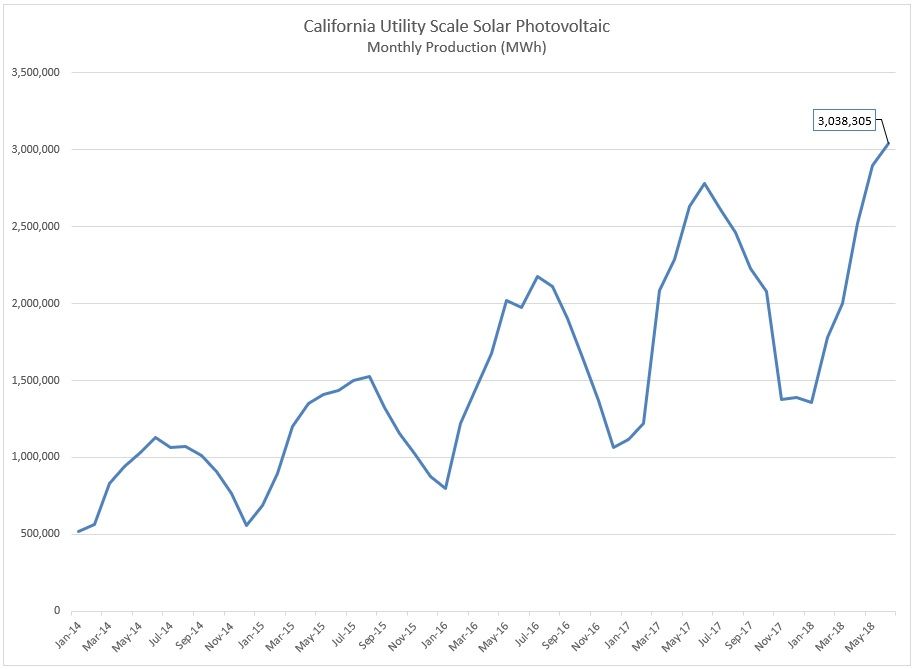
Solar Photovoltaic production in June is going to hit 3TWh for the first time to ever cross that level. I'll try and post updated graphs tomorrow sometime. Renewables will be about 34%.
RT
RT
Time for an update since some pretty significant milestones were hit. I mentioned last night that we hit 3TWh production for June. Here is an updated graph showing the new peak. The "peak" month in the year will be either June, July or August. I think this depends on the weather, and also if any additional production facilities come online during the month.
Now getting to the larger context of the solar photovoltaic production compared to total renewable and overall electricity production. This chart shows normalized data, with average MWh per day. Shows the progress being made with achieving the 33% renewable by 2020 goal.
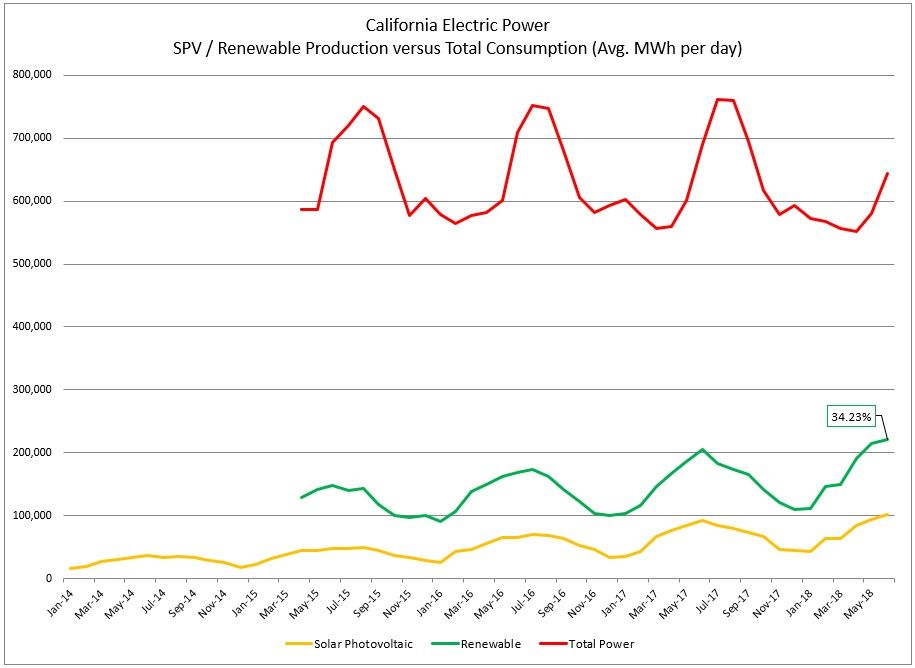
April 2018 is the first month that renewables hit the 33% goal. April through June yielded: 34.5%, 37.1% and 34.2%. This bodes very well for the 33% by 2020 target, even when you factor in the low solar months. Part of this is because if you look closely at the "total power" data, it is actually declining over time.
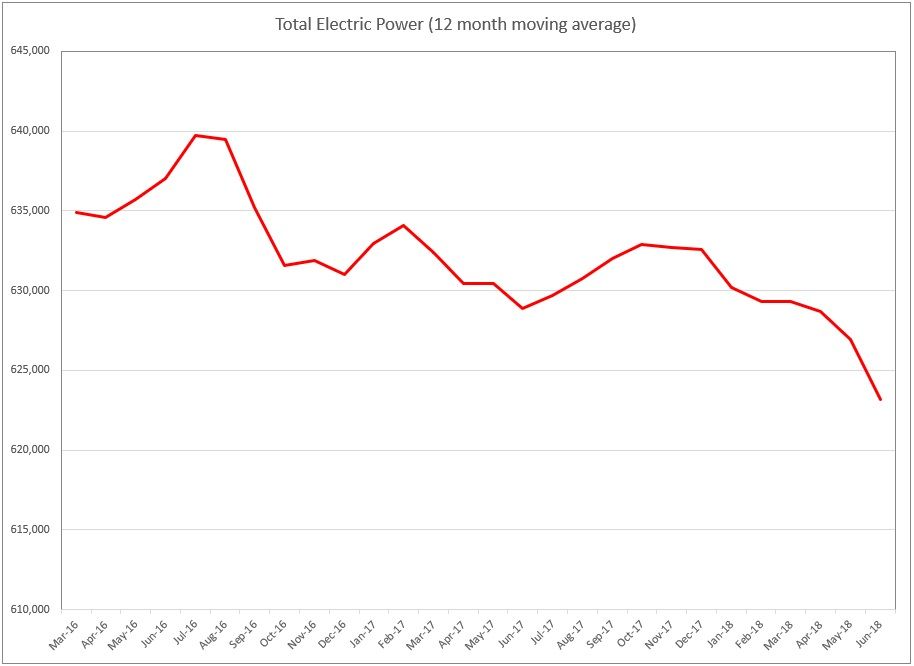
The above chart tracks total power with a 12-month moving average. Each month shown is the average total power over the preceding 12 months. Lots of things play into this, but a couple things seem clear. The population is growing over this time, and the overall temperature trend is that it is getting warmer too. You would think that just based on that that power consumption would be increasing, but it is trending down. Only slightly down, but still trending down.
I think that a part of this is related to home installs of solar panels starting to cut into the amount of power needing to be generated by the utilities. So its not just a matter of renewables rising over time, its also that total power required is also decreasing. As many others have pointed out, storage is going to be a player when renewables increase much above where they currently are. The CAISO needs to be able to shift the mid-day solar production toward the evening hours when A/C use is at maximum.
I just came across this link on the CAISO website, which is a two page short explanation of how various Western U.S. utilities are joining it as part of the Western Energy Imbalance Market (EIM):
http://www.caiso.com/Documents/ManagingAnEvolvingGrid-FastFact.pdf
Here is a picture from the link showing currently participating entities, along with those that will be coming on board soon:
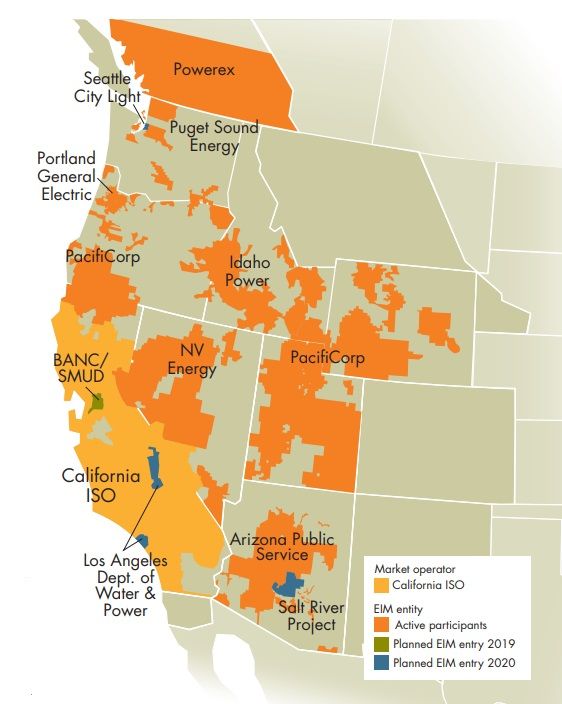
The beauty of this concept is that by intelligently connecting these power suppliers together, you can reduce geographic reliance on a single source. As the link says: Solar power produced in California at Noon can serve afternoon demand in Utah, and evening winds in Wyoming can power peak California demand in late afternoons.
This is really the "low hanging fruit" WRT getting a higher renewable % penetration into the western grid. By this I mean that doing this is nothing more than a coordination and sharing exercise that doesn't require any new physical plant assuming the wires are already in place. Much easier to do this than trying to build very large storage locally to capture and shift to a peak demand time. That will still need to be done, but sharing power with your neighbors makes that next storage investment much less expensive.
Lastly, the latest edition of Scientific American had a nice article about weather smart electric grids, and describe how the eventual installation of high voltage DC transmission lines across regions may be needed to get to even higher levels of renewable power:
Weather-Smart Electric Grids Are Needed for Wind and Solar Power to Surge
This takes the CAISO EIM described above to the next level, by tying together larger parts of the country or even North America. All exciting stuff, with lots to look forward to as we continue on toward 100%.
RT
Now getting to the larger context of the solar photovoltaic production compared to total renewable and overall electricity production. This chart shows normalized data, with average MWh per day. Shows the progress being made with achieving the 33% renewable by 2020 goal.
April 2018 is the first month that renewables hit the 33% goal. April through June yielded: 34.5%, 37.1% and 34.2%. This bodes very well for the 33% by 2020 target, even when you factor in the low solar months. Part of this is because if you look closely at the "total power" data, it is actually declining over time.
The above chart tracks total power with a 12-month moving average. Each month shown is the average total power over the preceding 12 months. Lots of things play into this, but a couple things seem clear. The population is growing over this time, and the overall temperature trend is that it is getting warmer too. You would think that just based on that that power consumption would be increasing, but it is trending down. Only slightly down, but still trending down.
I think that a part of this is related to home installs of solar panels starting to cut into the amount of power needing to be generated by the utilities. So its not just a matter of renewables rising over time, its also that total power required is also decreasing. As many others have pointed out, storage is going to be a player when renewables increase much above where they currently are. The CAISO needs to be able to shift the mid-day solar production toward the evening hours when A/C use is at maximum.
I just came across this link on the CAISO website, which is a two page short explanation of how various Western U.S. utilities are joining it as part of the Western Energy Imbalance Market (EIM):
http://www.caiso.com/Documents/ManagingAnEvolvingGrid-FastFact.pdf
Here is a picture from the link showing currently participating entities, along with those that will be coming on board soon:
The beauty of this concept is that by intelligently connecting these power suppliers together, you can reduce geographic reliance on a single source. As the link says: Solar power produced in California at Noon can serve afternoon demand in Utah, and evening winds in Wyoming can power peak California demand in late afternoons.
This is really the "low hanging fruit" WRT getting a higher renewable % penetration into the western grid. By this I mean that doing this is nothing more than a coordination and sharing exercise that doesn't require any new physical plant assuming the wires are already in place. Much easier to do this than trying to build very large storage locally to capture and shift to a peak demand time. That will still need to be done, but sharing power with your neighbors makes that next storage investment much less expensive.
Lastly, the latest edition of Scientific American had a nice article about weather smart electric grids, and describe how the eventual installation of high voltage DC transmission lines across regions may be needed to get to even higher levels of renewable power:
Weather-Smart Electric Grids Are Needed for Wind and Solar Power to Surge
This takes the CAISO EIM described above to the next level, by tying together larger parts of the country or even North America. All exciting stuff, with lots to look forward to as we continue on toward 100%.
RT
TheTalkingMule
Distributed Energy Enthusiast
That's not "what it costs for homes", that's what most installers in the US have been charging for homes. In Germany install costs have been below $2.25/W for something like 5 years, Australia is even lower.No, you have your prices right, someone above said $1/watt plus labor. No way in hell. Your $3 to $4 a watt is what it costs for homes.
And it's not labor cost making up most of the ticket price, it's total soft costs. Mostly customer acquisition and general inefficiencies.
bkp_duke
Well-Known Member
That's not "what it costs for homes", that's what most installers in the US have been charging for homes. In Germany install costs have been below $2.25/W for something like 5 years, Australia is even lower.
And it's not labor cost making up most of the ticket price, it's total soft costs. Mostly customer acquisition and general inefficiencies.
There are a lot of hands in the pie, for sure. Here is a breakdown on price for residential installs (existing homes), by a US Gov analysis, last updated Sept 2017:
Solar Panel Installation Cost: Cost Per Watt and Levelized Cost Explained. Data from 2017.
There still is a lot of fat to trim. This is of course cheaper if solar is integrated from the start into a new home (less hands in the pie).
mspohr
Well-Known Member
The Sierra Club had an interesting letter on this regional grid. Their concern is that it could lead to more fossil fuel use as other areas kept fossil plants online to meet needs in California.Time for an update since some pretty significant milestones were hit. I mentioned last night that we hit 3TWh production for June. Here is an updated graph showing the new peak. The "peak" month in the year will be either June, July or August. I think this depends on the weather, and also if any additional production facilities come online during the month.
Now getting to the larger context of the solar photovoltaic production compared to total renewable and overall electricity production. This chart shows normalized data, with average MWh per day. Shows the progress being made with achieving the 33% renewable by 2020 goal.
April 2018 is the first month that renewables hit the 33% goal. April through June yielded: 34.5%, 37.1% and 34.2%. This bodes very well for the 33% by 2020 target, even when you factor in the low solar months. Part of this is because if you look closely at the "total power" data, it is actually declining over time.
The above chart tracks total power with a 12-month moving average. Each month shown is the average total power over the preceding 12 months. Lots of things play into this, but a couple things seem clear. The population is growing over this time, and the overall temperature trend is that it is getting warmer too. You would think that just based on that that power consumption would be increasing, but it is trending down. Only slightly down, but still trending down.
I think that a part of this is related to home installs of solar panels starting to cut into the amount of power needing to be generated by the utilities. So its not just a matter of renewables rising over time, its also that total power required is also decreasing. As many others have pointed out, storage is going to be a player when renewables increase much above where they currently are. The CAISO needs to be able to shift the mid-day solar production toward the evening hours when A/C use is at maximum.
I just came across this link on the CAISO website, which is a two page short explanation of how various Western U.S. utilities are joining it as part of the Western Energy Imbalance Market (EIM):
http://www.caiso.com/Documents/ManagingAnEvolvingGrid-FastFact.pdf
Here is a picture from the link showing currently participating entities, along with those that will be coming on board soon:
The beauty of this concept is that by intelligently connecting these power suppliers together, you can reduce geographic reliance on a single source. As the link says: Solar power produced in California at Noon can serve afternoon demand in Utah, and evening winds in Wyoming can power peak California demand in late afternoons.
This is really the "low hanging fruit" WRT getting a higher renewable % penetration into the western grid. By this I mean that doing this is nothing more than a coordination and sharing exercise that doesn't require any new physical plant assuming the wires are already in place. Much easier to do this than trying to build very large storage locally to capture and shift to a peak demand time. That will still need to be done, but sharing power with your neighbors makes that next storage investment much less expensive.
Lastly, the latest edition of Scientific American had a nice article about weather smart electric grids, and describe how the eventual installation of high voltage DC transmission lines across regions may be needed to get to even higher levels of renewable power:
Weather-Smart Electric Grids Are Needed for Wind and Solar Power to Surge
This takes the CAISO EIM described above to the next level, by tying together larger parts of the country or even North America. All exciting stuff, with lots to look forward to as we continue on toward 100%.
RT
"For instance, as Sierra Club’s experts on how energy companies and markets in the west work note, it’s very possible that if not designed the right way, a regional grid could result in “resource shuffling.” That is, it might actually encourage certain coal-heavy power companies to extend the life of their plants in one part of the west and shift the renewable energy to California. Or it could fire up more natural gas plants here and in other states."
It could also weaken California's effort to move to clean renewable energy.
https://www.sierraclub.org/sites/ww...ub-california/PDFs/Jointoppose_AB813_TURN.pdf
100% renewable makes it out of committee to the full assembly:
California revives 100-percent carbon-free energy bill
Looks to raise the 50% by 2030 to 60% by 2030 instead, and 100% by 2045. Also mentions the above discussed idea of turning the ISO into a regional entity.
My favorite quote from Assemblyman Jim Patterson (R-Fresno): “Not now,” said Assemblyman Jim Patterson, a Republican from Fresno. “This is a leap of faith and a gamble.”
Seems he has an interesting concept of "now", when the end goal is 27 years in the future, and we are well on our way there already with 34% renewable last month. Also, apparently he doesn't think that pouring endless gigatons of CO2 into the atmosphere between now and then isn't a "gamble", but slowly phasing CO2 emissions is a gamble.
Makes you wonder why 25% of registered voters are still clinging to this idealess rudderless suicide cult that the California Republican party has become.
It's a good thing they have no relevance in the legislature, even less so come November.
California Focus: The elephant not in the room
"The rise in gross domestic product put California’s pace of growth far ahead of low-tax states like Texas and Florida, which style themselves as the wave of the future and California’s chief rivals. Economic and job growth has far outstripped the nation as a whole, accounting for the lion’s share of national growth."
"California is doing well by almost every measure. The latest ranking by the often-cited Wallethub website of the best and worst state economies in the nation – out early this month – placed California in fourth place, contrary to GOP rhetoric that routinely calls this a rotten place to do business."
RT
Also an interesting group of collaborators. Some strong union support which seem to be more concerned about jobs. I am not sure I understand the complexity of this.The Sierra Club had an interesting letter on this regional grid. Their concern is that it could lead to more fossil fuel use as other areas kept fossil plants online to meet needs in California.
cpa
Active Member
My favorite quote from Assemblyman Jim Patterson (R-Fresno): “Not now,” said Assemblyman Jim Patterson, a Republican from Fresno. “This is a leap of faith and a gamble.”
Ahh, good ole Jim. Our former mayor. Very conservative businessman who owned broadcast properties here and in Idaho.
His constituency is primarily rural and ruralized urban (in other words, heavy agricultural and agricultural support businesses whose owners/employees live in the greater Fresno/Clovis metro area.)
Gotta stay in the 1950s Jim!
Greenhouse gas emissions target reached 4 years ahead of 2020 deadline. Next goal is 40% below 1990 levels by 2030.
"The savings relative to the peak in 2004 are equivalent to taking 12 million cars off the road."
When half the cars scooting around the state are electric, the analogy of "taking X million cars off the road" is going to need to be reworded. A smart 10 year old might ask: Why would taking 12 million Teslas off the road reduce pollution?
California Beat Its 2020 Emissions Target Four Years Early
Cue my good buddy @McRat to allow him to chime in how reducing the greenhouse gas levels to 1990 equivalent levels has absolutely decimated the California economy (it hasn't), driven businesses and jobs out of the state (it hasn't), and caused all sane people to pack up and leave for the conservative tax wonderland of Kansas (it hasn't).
RT
SageBrush
REJECT Fascism
What is the target in terms of 1990 emissions ?Greenhouse gas emissions target reached 4 years ahead of 2020 deadline.
What is the target in terms of 1990 emissions ?
The 2020 target was simply to be less than the 1990 values. Despite larger population, and higher economic output, goal was met.
RT
SageBrush
REJECT Fascism
Thank you.The 2020 target was simply to be less than the 1990 values. Despite larger population, and higher economic output, goal was met.
So even one of the most progressive economies on Earth could not meet the extremely modest Kyoto accord more than 25 years later. Depressing.
I haven't looked into how they perform inventory on this. Do you know if they include tourism, travel, and exports? These are "soft" emissions that are often overlooked when communities do their GHG inventory. And these sources seem likely to have increased more than proportionally since 1990.
SageBrush
REJECT Fascism
YES, and to encourage development in wind rich areas.installation of high voltage DC transmission lines across regions may be needed to get to even higher levels of renewable power:
Similar threads
- Replies
- 1
- Views
- 167
- Replies
- 2
- Views
- 430
- Replies
- 41
- Views
- 2K
- Replies
- 13
- Views
- 712