Welcome to Tesla Motors Club
Discuss Tesla's Model S, Model 3, Model X, Model Y, Cybertruck, Roadster and More.
Register

Coronavirus

This site may earn commission on affiliate links.
Clue: positive test load is a poor predictor of community infection burden.

You would be much better off paying attention to hospitalization data. That is not available so far as I know for NYS but Cuomo has said that that discharges > admissions. That is a fine leading indicator, and it gives confidence to the IHME projection
Admissions are still greater than discharges. It's confusing because he's always talking about the change (slope) in hospitalizations and he doesn't always show the slide with the number of current hospitalizations. He is 100% focused on system capacity.
Screen Shot 2020-04-09 at 7.57.41 AM.png
Screen Shot 2020-04-09 at 7.56.34 AM.png
 
Potential problem in US about to hit. The incentives to quit work if you are in a critical job are now higher than staying at work for a very high percentage of workers. They didn't do the math before the vote. The employee can choose to quit, and if they make under $25/h it pays more to quit in most states.

Did they change the rules such that you get unemployment when you quit? (That normally precludes you from getting unemployment.)
 
Did they change the rules such that you get unemployment when you quit? (That normally precludes you from getting unemployment.)
Yes, you state you fear C19 and that exempts you from the waiting period and 'quit' rules.
It is frightening how far our Congress is detached from daily life in America.

This could be why we are seeing Fast Food strikes right now.
 
  • Informative
Reactions: MP3Mike
1% is really, really, frighteningly high. Scary, if true! See above. Definitely not something anyone (except possibly people under 20) would ever want to contract.

Not sure what was funny about this...

I think you’re viewing it the wrong way.

1%-2% of deaths are in the under 65 and no co-morbities. Therefore:

If that group were to constitute 1%-2% of the infected population (No way) then the fatality rate would be equal to the people not in that group.

If that group constitutes 50% of the infected population, then their fatality rate is a factor of 25X-50X less than the other group.

Therefore if fatality rate for over 65 or with a co-morbidity = 5%, then fatality rate for under 65 with none = 0.1%-0.2%.

Or at most 2X worse than the flu. If the percentage of the population under 65 with no co-morbidities is > 50%, or fatality rate for the other group is < 5%, then your chances would be even better.
 
Last edited:
Preliminary results of serological testing in a hard-hit area in Germany is out and the results are very interesting.

They tested every participant in the study by PCR and found 2% infected.

But antibody testing (IgG/IgA) found 15% had been infected -- 7.5X higher.

https://www.land.nrw/sites/default/...ischenergebnis_covid19_case_study_gangelt.pdf (in German)

this matches my confirmation bias, many who are young and fit get over it fast, really fast and don't even know it.
I mean, look at the general rates for 5-9 and 10-19 they got to be wrong, either they have a special ability to not catch Corona19 or they just get over it quickly like many other common colds. I suspect its the later.

'Virus concentration during an infection event of a person can be reduced so far may result in less severe illness simultaneous training of immunity' google translate, but the drift is clear. a tiniest dose to start covid19 allows time for the body to train for immunity, thus reducing the fatality rate down significantly (because it already is a barely fatal disease)
 
  • Like
Reactions: EinSV
FYI - the fellow who did the best job of analyzing and drawing conclusions about what do to ASAP as early as March 10, Tomas Pueyo on Medium.com in case you haven't heard. Best is that he DOES support his conclusions by solid figures and rationales that anyone with a minimal reasoning ability can follow. No need for advanced degrees to understand his analysis. And they have been validated by credible authorities by now too.

Tomas Pueyo's recent update via www.facebook.com/tomaspueyo
Note that I also found it best to get news from Twitter as so much of the mainstream news are filtered, politicized and repetitive anyway. The trick is following credible sources on Twitter (some I follow are @ElonMusk of course, and also @DrRichardCheng1, @DrZoeHyde, @tomaspueyo, @nntaleb (Nicholas Taleb), @OpenJonathan (Jonathan Schwartz) )

Coronavirus - Update 4/5/2020

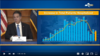
I heard people hopeful because the US was doing better, so I wanted to share 2 quick charts:
Chart 1 shows new daily cases per state (stacked). We can see a few things:

- We're adding 35k cases every day. That's a Hubei every 2 days (Hubei ended up with 70k cases officially, we're adding 35k every day. Yes I know these numbers might not be right, but we all understand the magnitude of what we heard about Hubei. This is what I'm comparing against: our perception of Hubei back in February, not the reality)

- The number of NEW CASES is still growing, although at least is seems linear. This means cumulative cases are not exponential anymore, even if they might look like it.

- 18 states have a decreasing or stable # of new daily cases over the last few days. That's great news for them. I ordered them so that they would appear at the bottom of the chart. The ones that are decreasing or neutral are up to CA, which is the grey one. Every state above that grey surface is growing.

Chart 2 is the counterpoint. It shows the daily cases growth rate vs. the % tests that are positive. Let me explain.
The horizontal axis shows how daily new cases are growing. A state like Alaska, which is growing at 10%, means that if today they have 100 new cases, tomorrow they have 110 new cases, the day after they have 121... And in a week they have 200. Being above 0 is generally bad news. Conversely, being on the left is good news: your daily new cases aren't growing as much anymore.
The vertical axis shows the % of tests that are positive. South Korea has 3%. If you're close to that, the idea is that you have a good grasp of the situation. If you're far, you have no idea.

So let's take for example North Dakota. It has only 3% of positives and their number of new cases is going down by 10% every day. That's a fantastic track record. They probably know what's going on, and what they know is that it's going down. Plus they have less than 200 cases total, so it might be a state that has things under control.
Let's compare with North Carolina. It grew over the last 3 days at 80% day over day in new cases. That's like multiplying by 60x in a week. Their testing is at 6% of positives, so maybe they're seeing all this growth just because they've ramped up testing. In any case, doesn't look good.

New York is still growing at 15% DoD, and their testing is at 40% positives, so they're still undercounting. This is bad.
Georgia and Mississippi are decreasing by ~10% every day. That sounds awesome! Except they have no idea because 24% of their tests are positive. So it might just be wishful thinking, luck, or bad testing.
The overarching point is that you have 5 green dots, 6 yellow / orange dots, and 39 red dots: states that either are still growing or don't know their situation.
This is still not great.
Stay safe. See you soon.

(see original post on FB for graphs) - note also that New York City is likely under reporting C19 deaths by maybe 40% since deaths at home are not tested nor reported for C19


Here are the series of article I think are all based on proper reasoning, with supporting historical data - a VERY rare and excellent series. The conclusions pronounced there slowly emerged in the public discourse, and till now STILL many do not get it

March 10
Coronavirus: Why You Must Act Now
Politicians, Community Leaders and Business Leaders: What Should You Do and When?

March 19
Coronavirus: The Hammer and the Dance
What the Next 18 Months Can Look Like, if Leaders Buy Us Time

April 1
Coronavirus: Out of Many, One
What the US Federal Government and the States Should Do to Fight the Coronavirus
More on why Tomas Pueyo is credible
Coronavirus Articles: Endorsements
Coronavirus Articles: Endorsements and public shares
From epidemiologists, experts, politicians and thinkers

I agree. Thomas Pueyo's group puts out superb stuff. Some of the best advanced layperson level summaries I've ever seen.
 
  • Like
Reactions: kbM3 and Dig deeper
Potential problem in US about to hit. The incentives to quit work if you are in a critical job are now higher than staying at work for a very high percentage of workers. They didn't do the math before the vote. The employee can choose to quit, and if they make under $25/h it pays more to quit in most states.


Not a huge problem. First, the statute is only in place for another 3.5 months. Second, we want people to stay home right now. Most jobs still being performed are far, far from 'critical.' So, if some people quit their crappy non-critical job in order to collect UI, good for them, good for slowing the virus, good for society.

Worst case scenario, essential businesses will have to temporarily raise the wages of their workers in order to keep them from quitting. Is this that bad?? Remember, this is only temporary.
 
I think you’re viewing it the wrong way.

No I am not. Note that I was just using his 1% number - I did not say that was true (it’s not, in fact).

Or 2X-4X worse than the flu.

That’s incorrect. The death rate from the flu for 18-49-year-olds is about 0.02%.

So it’s actually at least 10 times worse than the flu. (It’s substantially higher risk than 10 times in my 42-year-old bracket - likely closer to 20 times worse.) And the flu is no picnic.
 
I don't think so. Note that I posted the same slide from a day later and they changed the title to "Increase in total patients hospitalized"
For a sanity check, compare the graph of cumulative "hospitalizations" to daily "hospitalizations,"

And then look at the fraction of hospitalized compared to total positive tests, which we know to be ~ 10%
IIRC total positive tests are ~ 140k, so somewhere in the range of 14k hospital admissions
 
  • Funny
Reactions: AlanSubie4Life
Today Streek (Prof. Dr.), the initiator of the study in Heinsberg, presented indeed first results.
The press conference giving some results (in German) can be viewed here.

In an earlier interview (in German) about the study he explained in more detail what they were doing. In short:
A cross section of the population in the heavily affected district (Heinsberg) was studied in some detail:
- Participants were PCR tested and blood samples were taken for further analysis.
- Blood samples were tested for antibodies, among other things.
- Questionaires were completed for additional information.
- Selectively also pets (cats) and in one case a whole house, where several infected persons lived, were investigated more closely and samples from door knobs, kitchen and any other potentially interesting surfaces were taken. The samples taken were not only analised for the virus, but they also tried to find out whether those samples contained living viruses. Virus "shells" were found, but nothing living was identified.

Even the preliminary results are quite interesting already.

I can assure you that he emphasised that no infected cats were found and that the cats cooperated happily in the sampling process by chewing on the swabs used.

Maybe I will translate a few more tidbits later, but it might be better to wait for some written documentation, before jumping to broader conclusions.
 
Not a huge problem. First, the statute is only in place for another 3.5 months. Second, we want people to stay home right now. Most jobs still being performed are far, far from 'critical.' So, if some people quit their crappy non-critical job in order to collect UI, good for them, good for slowing the virus, good for society.

Worst case scenario, essential businesses will have to temporarily raise the wages of their workers in order to keep them from quitting. Is this that bad?? Remember, this is only temporary.

We will see. Hopefully it doesn't become fashionable to quit. Fast food and retail hard goods and Amazon aren't important.
Groceries are.

I hate to endorse hoarding but if you have children you should have some food in your panty that has a 1yr shelf life.
 
  • Disagree
Reactions: EVNow
For a sanity check, compare the graph of cumulative "hospitalizations" to daily "hospitalizations,"
Those agree of course. The total number of people currently hospitalized is equal to the sum of net hospitalizations. The net daily hospitalizations is equal to new hospitalizations minus people who are discharged and people who die.
Gov. Cuomo would not be talking about reaching an "apex" on a cumulative number, that wouldn't make any sense.
 
  • Like
Reactions: Doggydogworld
Thanks for posting, @EinSV . Showing forum visitors that those with COVID-19 under age 65 and having no underlying conditions having less than 1% chance of dying from the disease is extremely relevant information. How this country chooses to return to work while minimizing the deaths needs to take into account such information.

So, would you say Boris Johnson had less than 1% chance of death when admitted to ICU ?

Also, its not just fatality that matters. Hospitalization itself is a major risk in itself. I don't want to get the virus and end up in a hospital with pneumonia no more than I want to get into an accident and end up in a hospital with broken bones.