I have noticed that the Tesla app shows slightly increased home consumption (0.5 kWh to 1 kWh) whenever my solar production increases. When the production drops (eg: due to cloud cover), the home consumption shown on the app drops almost immediately. Anyone know why this happens? Are there any devices (inverter? gateway?) that consume more power when production increases? Even if they do, 0.5 kWh to 1 kWh seems like a lot.


Welcome to Tesla Motors Club
Discuss Tesla's Model S, Model 3, Model X, Model Y, Cybertruck, Roadster and More.
Register
Install the app
How to install the app on iOS
You can install our site as a web app on your iOS device by utilizing the Add to Home Screen feature in Safari. Please see this thread for more details on this.
Note: This feature may not be available in some browsers.
-
Want to remove ads? Register an account and login to see fewer ads, and become a Supporting Member to remove almost all ads.
You are using an out of date browser. It may not display this or other websites correctly.
You should upgrade or use an alternative browser.
You should upgrade or use an alternative browser.
Does your home consumption in Tesla app increase with production increase?
- Thread starter aswami
- Start date
roblab
Active Member
I have not noticed this. My home usage sits at about .5 to 1kW all day, then stays about .5 when we shut down. Well pumps, etc, cause brief spikes, but nothing unexpected. Right now my solar is making 7.5 kW, of which 7 is feeding the grid and .5 is running the house. So I have to say, when the solar panels are working, we're just selling it to PG&E. Power walls charge up and run the house in the evening when the sun's down.
It seems something is running when the sun comes out. Any cooling fans, etc,? Doesn't make sense.
It seems something is running when the sun comes out. Any cooling fans, etc,? Doesn't make sense.
jhn_
Member
I’ve noticed this a tiny bit but not to the degree you mention. Our panels are a 12.24kw east-west split. And when generating near their max output of 6-7kw I do see about 300w extra house consumption. The extra house load seems to drop off pretty quick when the generation drops below 6kw. 
One hypothesis based on no evidence other than an educated guess was that maybe our three Powerwalls are running their cooling systems more when a larger amount of charge is being sent to them resulting in more house load?
The pic below is the best example I can find and it doesn’t show much. This was a day that we were not home until about 4pm and gone the entire night prior. As you can see while the powerwalls are charging a slight “mound” in the graph of home usage that corresponds with the charging period. Then it reduces when the Powerwalls are full and power is being sent to the grid.
Attachments
Last edited:

aesculus
Still Trying to Figure This All Out
This sounds like a plausible answer.One hypothesis based on no evidence other than an educated guess was that maybe our three Powerwalls are running their cooling systems more when a larger amount of charge is being sent to them resulting in more house load?
Kcarver
Member
I’ve seen similar issue. I also see the Tesla app report 4-5kWh more in production at the end of the day than mySolarEdge app or my SRP Utility says I generated. yesterday Tesla app had 94.9kWh, SolarEdge had 90.09kWh and SRP had 88. Anyone seeing those large of differences?
aesculus
Still Trying to Figure This All Out
On my system (backup load center and main panel), the only external CTs are on loads and solar. I have one CT set on the circuit that is backed up and a split set on my HPWC that is not backed up in the main panel. Then another set on my two solar circuits. I suppose the PWs are being monitored by internal CTs or some other means.If home consumption is being calculated from the difference between solar production and grid export then if there is a calibration issue with one set of CTs you could have an issue like you are seeing.
I see nothing that is monitoring the actual grid side so I suspect that is either internal too or derived from the others.
charlesj
Active Member
I have a Tesla CT on my solar breaker. I also have micro inverters that registers with Enphase.
The difference in solar production at end of day is 0.5% to a bit more but less than 1% advantages to Tesla. Tesla averages at 5 min intervals, Enphase at 15 min.
The difference in solar production at end of day is 0.5% to a bit more but less than 1% advantages to Tesla. Tesla averages at 5 min intervals, Enphase at 15 min.
can you post a screen shot from the app?
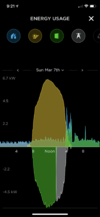
Please see the screenshots from a couple of days. Note the following things:
1. On either side of the solar production curves, the home consumption is relatively uniform. This is my baseline home consumption, with brief spikes when I turn on some device.
2. Under the solar production curve, the home consumption curve shows as a gradual slope (as opposed to the flat baseline) with the peak coinciding with the peak of solar production. So, there is something happening to increase and decrease the home consumption as the solar production increases and decreases!
I have the Tesla inverter with a liquid cooling fan inside it. But I just can't imagine this fan consuming so much power to show this kind of a home consumption curve.
DesertSilver
Member
I got PTO this week and seeing this same thing with home usage graph mimicking solar production. My home usage appears to be right around 50% of solar production, which is nowhere near reality.
Seems this is a “setting change” that needs to take place on the Tesla side, right? I put in a service request for this through Tesla last night and hoping it can be resolved soon.
(Large usage for early 4/21 was from charging my car)


Seems this is a “setting change” that needs to take place on the Tesla side, right? I put in a service request for this through Tesla last night and hoping it can be resolved soon.
(Large usage for early 4/21 was from charging my car)
DesertSilver
Member
Looks like I was able to fix this myself by going into the Tesla Inverter UI, removing and re-adding the Site Meter (Neurio).
After I did this the Instant Flow value in the Inverter UI doubled, so seems that data from only a single CT was being read before, somehow. Hopefully this stays fixed.
After I did this the Instant Flow value in the Inverter UI doubled, so seems that data from only a single CT was being read before, somehow. Hopefully this stays fixed.
We do notice a very slight increase in our household consumption during the day, but it's probably less than 300 Watts and is very steady throughout the day. As @jhn_ mentioned, maybe it's the inverters or the fans in the Powerwalls.Please see the screenshots from a couple of days. Note the following things:
1. On either side of the solar production curves, the home consumption is relatively uniform. This is my baseline home consumption, with brief spikes when I turn on some device.
2. Under the solar production curve, the home consumption curve shows as a gradual slope (as opposed to the flat baseline) with the peak coinciding with the peak of solar production. So, there is something happening to increase and decrease the home consumption as the solar production increases and decreases!
I have the Tesla inverter with a liquid cooling fan inside it. But I just can't imagine this fan consuming so much power to show this kind of a home consumption curve.
View attachment 649801 View attachment 649802
From your graphs, it looks like your CTs aren't configured correctly. Your "Today" image shows you have zero household load at times, which is possible but very unlikely. Can you post another graph showing your grid usage as well?
When our Powerwalls were first installed, things looked correct for the most part but we received a couple calls from Tesla. They noticed things didn't look quite right. They remotely changed the CT configuration and things got worse. A couple of hours later, they changed them again and everything started reporting correctly. A year later, we started getting some weird readings. Tesla came out and found one of the CTs had fallen and wasn't reporting correctly. Once they put it back where it belonged, everything looked fine again.
Give Tesla a call and ask them to check the CT configuration. If they were installed correctly, they can fix things remotely. If they weren't, then a site visit would be necessary. Technically, you can log into the gateway and change the configuration yourself but it's probably best to let Tesla make the changes since they probably have a better idea of what's going on.
Similar threads
- Replies
- 32
- Views
- 1K
- Replies
- 1
- Views
- 208
- Replies
- 8
- Views
- 1K