Welcome to Tesla Motors Club
Discuss Tesla's Model S, Model 3, Model X, Model Y, Cybertruck, Roadster and More.
Register

Energy Consumption axis?

This site may earn commission on affiliate links.

Gwgan

Almost a wagon
Aug 11, 2013
3,467
2,907
Maine
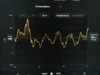
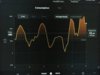
Please help me understand the left-most y-axis scale of the center console Consumption graph. It goes from -300 to +900 Wh/mi but does not scale when the interval changes. Lets say there is a consumption peak at the left hand side of a 30 mile window but during the most recent 25 miles the line bounces around 300Wh/mi. When the period is changed to the last 5 miles the graph seems to expand to fill the vertical space but the y-axis units remain unchanged and what was a 300Wh/mi peak is now over 900.

V17.11.0

How do people actually make use if this graph, other than by watching the actual consumption try but fail to coincide with the rated or ideal range line?
 

Attachments

  • IMG_1142.JPG
    IMG_1142.JPG
    379.9 KB · Views: 94
  • IMG_1143.JPG
    IMG_1143.JPG
    377.7 KB · Views: 69
In the 30 mile mode each dot corresponds to 6 dots in the 5 mile mode. Notice that only 2-3 dots in your 5 mile picture are at 900, when you average those 2-3 dots at 900 with the other 3-4 dots before and after you get the 600 average that is shown in your 30 mile view. Generally speaking the 5 miles view shows much more volatility.
Try camping behind a large truck on motorways to decrease drag and go well below rate consumption rates.
Also, I think Tesla should consider add capacitors (once they get cheap enough) to reduce efficiency penalties for fast accelerations.
 
Also, I think Tesla should consider add capacitors (once they get cheap enough) to reduce efficiency penalties for fast accelerations.

I don't think capacitors work the way you think they work. Capacitors need to get their energy from somewhere, and in this case it will be the battery. So you will use the same amount of energy for a fast acceleration whether you have a capacitor or not. Either it will come directly from the battery as it does now, or it will come from the capacitor, then the battery as it recharges the capacitor. But either way the power comes from the battery in the end. In fact, it will be slightly less effecient to use capacitors because some energy will be lost as it is transferred from the battery to the capacitor since charging a capacitor is not 100% effecient.

Capacitors can be charged and discharged more quickly than a battery, so the benefit to using a capacitor would be if the motor could draw more power than the battery could provide. In that case a capacitor could provide quicker acceleration in short bursts by being able to dump a lot of power to the motor quickly, but it wouldn't help with efficiency. In our case the battery can provide all the power the motor can take, so a capacitor wouldn't help.
 
I'd like for the instrument panel energy graph to show the current consumption in kilowatts, and for it to include power used by the climate system and other non-motive uses. The graph that exists there now appears to only include drive power, and there's not enough marks to make it informative.

I had this real-time consumption number in my Volt, and it was especially good to understand how much heater, AC, etc consumed.
 
Tesla clearly does some smoothing on all three versions of the consumption chart, with heavier smoothing on the longer range ones. I can go downhill in regen for half a mile and still not hit 0 on the 30 chart.

As far as using it goes, I mostly look at the trend relative to the phase I'm driving in to see how it matches up against rated and guess at my trip consumption. IT's useful data to have, but I really don't use it for much beyond understanding what is happening with the car at the time.