Welcome to Tesla Motors Club
Discuss Tesla's Model S, Model 3, Model X, Model Y, Cybertruck, Roadster and More.
Register

Fun with Powerwall 2 stats...

This site may earn commission on affiliate links.
Someone I know has done south facing 17 degree panels in Adelaide. In winter the southern panels produce near the same as his north panels. Less production in summer, but they produce more in the early morning and late arvi in summer than the north panels.

Now you've got me excited...I've got enough space on the south side for at least another 12KW's :rolleyes:

Trouble is my pitch is 33 degrees....maight work against me re South Side no? o_O
 
Now you've got me excited...I've got enough space on the south side for at least another 12KW's :rolleyes:

Trouble is my pitch is 33 degrees....maight work against me re South Side no? o_O
Quite probably - it also depends on the actual bearing of that roof plane. I suggest using the calculator at PVWatts Calculator - it seems to be pretty accurate and can generate an hour-by-hour statistical view of solar generation based on your location, orientation, PV parameters etc.

My roof is A-shaped for the entire length with 40° pitch. According to PVwatts, any panels on the south side would generate zero electricity in Winter because they would perpetually be in shade. They could be useful in summer, because due to the orientation of my house, the sun passes overhead on the long axis around 4pm and south panels would generate late-afternoon power which the north panels don’t. But more power in summer is not really what I need.
 
Now you've got me excited...I've got enough space on the south side for at least another 12KW's :rolleyes:

Trouble is my pitch is 33 degrees....maight work against me re South Side no? o_O
I suspect part of the 17 degree success is the fact that they are quite shallow angle. Its also worth noting that the performance of those panels is substantially better than the solar charts show for Adelaide. Regardless I think 30 degrees is probably not going to work, and agree with Vostok that having them in shade due to the steep angle is likely going to result in near zero power.
Note though that you can tilt your panels upwards at the base with an extension frame (very low cost) to create a shallower angle, but you need to be mindful of how it looks, and the shade angle of an elevated base means only 1 row would work.
 
It's a cold, wet weekend here in locked-down Sydney, so what else better to do than over-post in the Tesla forum and crunch some PW2 stats?

I now have 2 years worth of 5 minute data - 210,516 rows.

Over that time, my modest 5.84 kW array has generated a total of 15.56 MWh or 21.3 kWh/day. It generated a fair bit more in Year 1 (8.06 MWh) than Year 2 (7.50 MWh) which has been cloudier. This has not been enough to power my house (including EVs) which on average consumed 25.0 kWh/day. The power flows have been:
  • Solar to House: 7.1 kWh/day
  • Solar to Battery: 8.4 kWh/day
  • Solar to Grid: 5.8 kWh/day
  • Grid to Home: 10.1 kWh/day
  • Grid to Battery: 0.5 kWh/day
  • Battery to Home: 7.8 kWh/day
  • Battery to Grid: 0.0 kWh/day
So the value of the battery is clear - without it, 7.8 kWh of stored solar power per day would instead have come from the grid, beating the 7.1 kWh/day of solar that is used directly. The other benefit is enabling time-shifting of grid consumption:
  • Peak: 0.7 kWh/day (6.2%)
  • Shoulder: 2.6 kWh/day (24.6%)
  • Offpeak: 7.3 kWh/day (69.2%)
I draw nothing from the grid 67.7% of the time. The battery spends 18.7% of its time full and 22.8% of its time at minimum level (10%). My self-powered percentage is a slightly disappointing 59.5% but I can't fit any more panels on my roof. The most solar ever generated in a day was 36.01 kWh and the least 0.87 kWh.

Based on the data, I calculate the PV array+inverter efficiency to be 95.0% and battery roundtrip efficiency to be 93.7%.

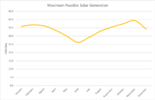
Finally a couple of interesting charts. The first one shows how much solar my array could generate if there was never a cloud in the sky. This is calculated by finding the maximum generation ever recorded in every time-consistent 5-minute period in a given week over the past 2 years. It adds up to 12.4 MWh per year, so my array has generated 62.7% of that. Or one could say the "cloud factor" in Sydney, based on this, is 37%. So if it was never cloudy I would be able to fully power my house from solar.

solarmax.png

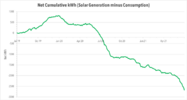
The next is the cumulative net position of solar generation minus consumption. After a glorious initial 10 months when I was well and truly in the black, it's gone south ever since May 2020. I put this down mostly to working from home since the pandemic hit, as well as increased consumption after getting my Model 3 in December 2019.


netcumulative.png
 
It's a cold, wet weekend here in locked-down Sydney, so what else better to do than over-post in the Tesla forum and crunch some PW2 stats?

I now have 2 years worth of 5 minute data - 210,516 rows.

Over that time, my modest 5.84 kW array has generated a total of 15.56 MWh or 21.3 kWh/day. It generated a fair bit more in Year 1 (8.06 MWh) than Year 2 (7.50 MWh) which has been cloudier. This has not been enough to power my house (including EVs) which on average consumed 25.0 kWh/day. The power flows have been:
  • Solar to House: 7.1 kWh/day
  • Solar to Battery: 8.4 kWh/day
  • Solar to Grid: 5.8 kWh/day
  • Grid to Home: 10.1 kWh/day
  • Grid to Battery: 0.5 kWh/day
  • Battery to Home: 7.8 kWh/day
  • Battery to Grid: 0.0 kWh/day
So the value of the battery is clear - without it, 7.8 kWh of stored solar power per day would instead have come from the grid, beating the 7.1 kWh/day of solar that is used directly. The other benefit is enabling time-shifting of grid consumption:
  • Peak: 0.7 kWh/day (6.2%)
  • Shoulder: 2.6 kWh/day (24.6%)
  • Offpeak: 7.3 kWh/day (69.2%)
I draw nothing from the grid 67.7% of the time. The battery spends 18.7% of its time full and 22.8% of its time at minimum level (10%). My self-powered percentage is a slightly disappointing 59.5% but I can't fit any more panels on my roof. The most solar ever generated in a day was 36.01 kWh and the least 0.87 kWh.

Based on the data, I calculate the PV array+inverter efficiency to be 95.0% and battery roundtrip efficiency to be 93.7%.

Finally a couple of interesting charts. The first one shows how much solar my array could generate if there was never a cloud in the sky. This is calculated by finding the maximum generation ever recorded in every time-consistent 5-minute period in a given week over the past 2 years. It adds up to 12.4 MWh per year, so my array has generated 62.7% of that. Or one could say the "cloud factor" in Sydney, based on this, is 37%. So if it was never cloudy I would be able to fully power my house from solar.

View attachment 683144

The next is the cumulative net position of solar generation minus consumption. After a glorious initial 10 months when I was well and truly in the black, it's gone south ever since May 2020. I put this down mostly to working from home since the pandemic hit, as well as increased consumption after getting my Model 3 in December 2019.


View attachment 683145
Analysing cloudless solar….lockdown is impacting on you. Hope it ends soon.
 
  • Like
Reactions: Hairyman
It's a cold, wet weekend here in locked-down Sydney, so what else better to do than over-post in the Tesla forum and crunch some PW2 stats?

I now have 2 years worth of 5 minute data - 210,516 rows.

Over that time, my modest 5.84 kW array has generated a total of 15.56 MWh or 21.3 kWh/day. It generated a fair bit more in Year 1 (8.06 MWh) than Year 2 (7.50 MWh) which has been cloudier. This has not been enough to power my house (including EVs) which on average consumed 25.0 kWh/day. The power flows have been:
  • Solar to House: 7.1 kWh/day
  • Solar to Battery: 8.4 kWh/day
  • Solar to Grid: 5.8 kWh/day
  • Grid to Home: 10.1 kWh/day
  • Grid to Battery: 0.5 kWh/day
  • Battery to Home: 7.8 kWh/day
  • Battery to Grid: 0.0 kWh/day
So the value of the battery is clear - without it, 7.8 kWh of stored solar power per day would instead have come from the grid, beating the 7.1 kWh/day of solar that is used directly. The other benefit is enabling time-shifting of grid consumption:
  • Peak: 0.7 kWh/day (6.2%)
  • Shoulder: 2.6 kWh/day (24.6%)
  • Offpeak: 7.3 kWh/day (69.2%)
I draw nothing from the grid 67.7% of the time. The battery spends 18.7% of its time full and 22.8% of its time at minimum level (10%). My self-powered percentage is a slightly disappointing 59.5% but I can't fit any more panels on my roof. The most solar ever generated in a day was 36.01 kWh and the least 0.87 kWh.

Based on the data, I calculate the PV array+inverter efficiency to be 95.0% and battery roundtrip efficiency to be 93.7%.

Finally a couple of interesting charts. The first one shows how much solar my array could generate if there was never a cloud in the sky. This is calculated by finding the maximum generation ever recorded in every time-consistent 5-minute period in a given week over the past 2 years. It adds up to 12.4 MWh per year, so my array has generated 62.7% of that. Or one could say the "cloud factor" in Sydney, based on this, is 37%. So if it was never cloudy I would be able to fully power my house from solar.

View attachment 683144

The next is the cumulative net position of solar generation minus consumption. After a glorious initial 10 months when I was well and truly in the black, it's gone south ever since May 2020. I put this down mostly to working from home since the pandemic hit, as well as increased consumption after getting my Model 3 in December 2019.


View attachment 683145
Hey Vostok, how do you get the exported data? Do you export..every..single..day?
I had a statsgasmic spreadsheet setup for my enphase system, but adding a PW2 wrecked the data export. So the only way I know is to painfully and labourishly export via the phone app.

Is there a better way?
 
The first one shows how much solar my array could generate if there was never a cloud in the sky. This is calculated by finding the maximum generation ever recorded in every time-consistent 5-minute period in a given week over the past 2 years. It adds up to 12.4 MWh per year, so my array has generated 62.7% of that.
Why do you think there's a double-peak in that chart? (or, why are December and January so low?)
 
Hey Vostok, how do you get the exported data? Do you export..every..single..day?
I had a statsgasmic spreadsheet setup for my enphase system, but adding a PW2 wrecked the data export. So the only way I know is to painfully and labourishly export via the phone app.

Is there a better way?
yeah powerwall completely destoys the enphase data. Its just not compatible. The only way to check your panels are working is either with an amp Meter or turn off the powerwall for a day. You can download the data as a ccv excel file from the powerwall app. It is accurate, but do a test to make sure it is.
 
Hey Vostok, how do you get the exported data? Do you export..every..single..day?
I had a statsgasmic spreadsheet setup for my enphase system, but adding a PW2 wrecked the data export. So the only way I know is to painfully and labourishly export via the phone app.

Is there a better way?
I wish there was a better way (I have suggested it to Tesla) but yes… I have to export every single day.

Usually I do a week or two on a Sunday morning. Scroll back through the days on the App and save each day to a Note in the Notes App. I email the note to myself at the end of the month, and wrote a script to ingest the data into my spreadsheet. The rest is Visual Basic macros in Excel.
Thats commitment!
 
Why do you think there's a double-peak in that chart? (or, why are December and January so low?)
There’s a double peak due to the steepness of my roof and its orientation (the ridge is almost due east-west). From November to January, the arc of the sun traces more over the south-facing roof plane rather than the north-facing one, and this causes a reduction in generation even though the sun is up longer. The rest of the year, the arc is almost entirely on the north side.

If my roof wasn’t so steep this wouldn’t make as much difference. Or if I had panels on the south side as well (but they would generate very little power for 8 months of the year).
I know someone with panels on the north and south of a 15 degree pitched roof in adelaide. The south panels have the same output as the north in winter, which is a huge surprise. Not the case in other seasons though.
presumably its because there is no direct sun due to cloud cover, so its all just ambient light. Probably different on a steep pitch though.
 
Thats commitment!
Or… an unhealthy obsession 😄

Now that the downloaded files also record the battery charge state, I crazily scrolled back a whole 2 months so that I have that data as well from 1 July. Even I drew the line at scroling back a whole year… or more.

My spreadsheet previously tried to calculate battery charge state based solely on the power flows, but that’s an imperfect method that drifts over time and required regular correction.
 
If Tesla ever makes it easy it download months of 5-minute data at a time, it would be interesting to see how long the data is stored for - how far one could scroll back.

Is the PW2 data stored in the gateway or in the cloud? The raw data doesn’t use much space, about 10 kB per day.

With my LEAF, Nissan only kept the telemetry/trip data in the cloud for 6 months.
When tesla corrupted my powerwall data recently I was told it was stored in the gateway, and if a full factory reset was required all data would be lost. Hence downloading the file regularly and doing your own charting is about as good as you will get for a backup.
 
I wish there was a better way (I have suggested it to Tesla) but yes… I have to export every single day.

Usually I do a week or two on a Sunday morning. Scroll back through the days on the App and save each day to a Note in the Notes App. I email the note to myself at the end of the month, and wrote a script to ingest the data into my spreadsheet. The rest is Visual Basic macros in Excel.
Cheers Vostok, confirmed my suspicion of either crap software or some deliberate reason to make it hard…

I now export about a month at a time - takes about 10 minutes as a save to Dropbox and then use a dos command to combine the csv files. Tidy up the duplicates and use a pivot table to identify gaps, then rinse and repeat for another month.

so ive got about 8 months now, it’s amazing how much you can get done in lockdown teams meetings…

as an aside, the one redeeming feature of the new app interface is it‘s slightly easier to navigate to a new day.
 
  • Like
Reactions: Hairyman
Hey Vostok, how do you get the exported data? Do you export..every..single..day?

Is there a better way?
I’ve been doing some more research on this and I think “a better way” is possible through the public API that third party developers use to build their apps that control Tesla products (https://owner-api.teslamotors.com). This is the same API Tesla’s own app uses.

I couldn’t find a ready-made script that someone has created to download historical data, but this site shows the API has a command /api/1/powerwalls/:battery_id/calendar_history to fetch historical PW2 data, you also have to pass additional parameters to define what data you want and the date you want it for.

Apparently Tesla recently improved security on the API so that the process of writing a script to login to the API, authenticate and get a token is a lot more involved than it used to be…

One can also directly access the API on the PW2 Gateway which doesn’t involve logging in to the Tesla public API and is therefore more straightforward, but it has a different command set and I haven’t been able to find a command which retrieves historical data. The instant energy data is easy enough to fetch, but surely the historical 5-minute data is also there? Because presumably the public API interrogates the PW2 gateway with a certain command to fetch the historical data the Tesla App displays.

This GitHub project enables the instant energy stats to be fetched from the Gateway.
 
Now that my PW2 spreadsheet is more robust, I've done an exact, time-based comparison between my 4 most recent quarterly power bills and the power flows reported by the PW2. There is a discrepancy over the 12 months which is curious:
  • Peak: 0.6% (i.e. My power bill reports 0.6% more peak grid power consumed than what PW2 reports)
  • Shoulder: 9.9%
  • Offpeak: 5.4%
  • Overall: 6.0%
  • Solar Export: 0.5% (i.e. the power bill reports slightly more solar export than what PW2 has)
The discrepancies vary on a quarter-by-quarter basis and appear to be related to the total amount of grid power used in quarter. The more grid power used, the smaller the discrepancy, e.g. I used the least grid power in the most recent quarter, and the overall difference was 10.8%. The quarter in which I used the most grid power the difference was only 3.7%.

But this inconsistency does not apply to time-of-day comparisons. The error is largest during shoulder periods, which represents only about 20% of my grid consumption. 72% of my grid consumption is at offpeak rates.

I suspect the root cause is that the PW2 power meters are, well, not exact. Tesla is not obliged to have metering that complies with the same standards of accuracy as grid metering does. There appears to be a weird but systematic error in them.

At least the solar export figure appears to be pretty reliable, I'm not sweating a 0.5% difference, and it's in my favour 😁
I worked through this issue with tesla australia. (Tesla usa were useless). Essentially when the powerwall is supplying power if you have activation of a sudden high draw appliance the grid actually takes over for a few seconds. This brief power spike shows on your grid meter but not tesla meter, which are just CT based. Its a bit wierd though given batteries within a grid are intended to take the spikes. It also doesn’t occur if solar is feeding the house entirely, which is why it is worse in the evenings and at night. Tesla were able to reduce the difference by switching the two meters, but it didnt change the grid consumption issue, just gave more accuracy to powerwall. Some people may not experience this as they may not use a sudden high draw appliance.
 
  • Informative
Reactions: Hairyman and Vostok