


Welcome to Tesla Motors Club
Discuss Tesla's Model S, Model 3, Model X, Model Y, Cybertruck, Roadster and More.
Register
Install the app
How to install the app on iOS
You can install our site as a web app on your iOS device by utilizing the Add to Home Screen feature in Safari. Please see this thread for more details on this.
Note: This feature may not be available in some browsers.
-
Want to remove ads? Register an account and login to see fewer ads, and become a Supporting Member to remove almost all ads.
You are using an out of date browser. It may not display this or other websites correctly.
You should upgrade or use an alternative browser.
You should upgrade or use an alternative browser.
Gateway 2 and Smart Meter accuracy
- Thread starter mikemillar
- Start date
charlesj, the new smart meters may well be very accurate, but there have been a number of reports in the past that they can record ridiculous amounts of consumption. Some of these appear to be be complaints by people who haven't done a rigorous analysis of external factors, like a very hot period in California with air-con going full blast just after the meter was fitted. However it's necessary to carry out carefully controlled tests to find out the truth. I think I've read in a smart meter specification that my particular meter is accurate to within 1%. Presumably that means that a load of 1kW would be displayed to within 10W accuracy. That's a reasonable accuracy. The label on the Gateway says "Meter Class 0.2%" - whatever "meter class" may be! My smart meter only displays to a resolution (different from "accuracy") of 1kWh. However, my remote display reads to 10W resolution and the daily readings displayed on my login page on the company website read to a resolution of 10Wh. My investigation so far seems to indicate that the meter is quite accurate, although I can't test it against a verifiable standard. That requires rather specialised and costly test equipment. There may also be other factors involved - like meter recording import but not export.
I would add that if you have one of the very old meters with the spinning disc that can record backwards, and have solar export, you might well get a shock (no pun intended) if the meter is replaced with a more modern one. Some people have recorded negative grid consumption with the old meters and lots of solar export!- and been paid for the export recorded by the separate meter as well! The electricity companies in the UK, at least, don't seem to have caught up with that yet.
charlesj
Active Member
@mikemillar, thanks. The meters are revenue generating and am sure England would have similar laws, that, like a scale or a gas pump, must be very accurate or the company would skew to the higher side to make more money.
I bet that 0.2% is the real accuracy.
I have a smart meter and it reads to 3 decimal places, 1W when power company is delivering power and is less than 1 kWh.
Above this it shows 2 decimal places. I am also pretty sure that while it is only 2 places, the info transmission to the company is down to a watt. The charge rate is $xx/1kWh. So we pay to a whole kWh but I bet the leftover is carried forward.
Accuracy usually reduces at the ends of the scale. On digital electricity meters there is no defined maximum, but at very low current the accuracy will reduce. However, I don't think I'd quibble about the odd watt or two. With the old mechanical meters they probably don't read at all at very low current, which may be why my old meter wasn't recording any peak demand from the Powerwall. We just looked at my friend's meter, which is the old rotating disc type. He has 4 powerwalls and we measured the apparent grid demand current at over 5 amps, i.e. about 4 times what I measured on my single powerwall, so it appears to be consistent. However, his disc wasn't rotating at all in either direction, maybe jittering slightly, difficult to see. Of course, since his can rotate backwards it may even out, because the powerwall appears to alternate between a few watts demand and a few watts export.
The actual grid flow data I'm downloading from the gateway oscillates a few watts either side of zero, it rarely exceeds 10 watts on a 5 minute download interval. Over a day it pretty much sums to zero. But this may not be the whole story as the smart meter is showing a fairly constant demand of 60-80 watts , occasionally more, or less, with a 10 second refresh interval. I have seen zero once or twice but very rarely. My smart meter isn't smart enough to subtract the export part of this very small demand so I am being charged for what it takes from the grid, at 24.5 UK pence per kWh, but not credited with what it puts back. It probably clocks up a similar power flow during the 7 hour night rate period but that is disguised by charging the battery, heating my hot water tanks and generally providing the house power supply, - the powerwall doesn't normally supply the house during the off-peak time I've set on the app. Also I'm only paying 4.9 pence per kWh so it's not a major issue during the 7 hour night rate period - maybe 2-3 pence per day, as opposed 50 pence per day during the Peak rate period.
The actual grid flow data I'm downloading from the gateway oscillates a few watts either side of zero, it rarely exceeds 10 watts on a 5 minute download interval. Over a day it pretty much sums to zero. But this may not be the whole story as the smart meter is showing a fairly constant demand of 60-80 watts , occasionally more, or less, with a 10 second refresh interval. I have seen zero once or twice but very rarely. My smart meter isn't smart enough to subtract the export part of this very small demand so I am being charged for what it takes from the grid, at 24.5 UK pence per kWh, but not credited with what it puts back. It probably clocks up a similar power flow during the 7 hour night rate period but that is disguised by charging the battery, heating my hot water tanks and generally providing the house power supply, - the powerwall doesn't normally supply the house during the off-peak time I've set on the app. Also I'm only paying 4.9 pence per kWh so it's not a major issue during the 7 hour night rate period - maybe 2-3 pence per day, as opposed 50 pence per day during the Peak rate period.
sashton
Member
I'm sorry I missed the earlier parts of this discussion but it is a subject that has lit up many groups in the old interweb. I started with PW2s on the original gateway and upgraded to the BuGV2 early this year. With the advent of many export harvesting systems it became obvious that few of them actually agree with each other let alone the supply meter.
I was told the V2 gateway would be better/faster at responding to changes in export/demand but I have found no evidence to support this assertion. While it was true that at early firmware versions did have problems tracking grid flow in the advanced modes, resulting in surprisingly large aggregate imports and exports, recent versions on the V2 appear to have cured this issue although this could have been addressed by a firmware update. I'm certainly not going to wire in the old GWv1 just to check!
My recent experience is that grid flow actually oscillates to a far greater extent than measured by mikemillar. On a high sample rate meter I see spikes of up to 200W in both directions. The Fronius meter (which claims MID certification) constantly shows lower aggregate grid flow and agrees within 0.5% with /api/meters/aggregates over 30 second samples. The Myenergi EVSE grid data from their API appears the least accurate but since it uses grid export to trigger a car charge session and lack thereof to terminate the session its unexpected behaviour led me to look for these spikes in the first place.
In order to stop the PW and the Myenergi Eddi/Harvi from "fighting" for the first instance of an export it is necessary to increase the export threshold in the Zappi/Eddi to permit the battery to react first. Once there is insufficient export the Zappi/Eddi has a timer during which the export must stay below the threshold for the charge session to stop. This was constantly being interrupted, even with thresholds as high as 100W - hence my investigation.
On a price basis these "leaks" cost me around 1.2kWh/day or about 16pence (Octopus Agile tariff) - no great issue..
Thanks sashton - it looks like my Powerwall behaviour is not unique. However, it does appear to be out of Tesla's specification. I've just sent my 7 days worth of meter readings to Tesla Energy, so I'm waiting with baited breath for their response! My 7 day average peak consumption has worked out at 1.3kWh per day, about the same as yours. I'm paying 24.5p/kWh peak, but paying 4.9p/kWh night rate, which is very worthwhile if one uses hardly any peak rate electricity. In those terms an unexpected £150 per year does become a significant issue, it's 20% of my yearly electricity bill that I wasn't expecting! Tesla don't tell you that it draws maintenance power from the grid and it rather upsets the long term financial model I constructed before deciding to buy the Powerwall 2.
One thing is that the meter is recording the 1.3kWh per day demand but not the balancing export from the battery. The smart meter is designed to measure this but EDF haven't activated export monitoring on my meter. If it did, it would not be able to separate out solar and battery export. Presumably when the idea of home batteries supplying the grid becomes a reality, export metering will become commonplace. Of course, In a way I can't complain, since I'm being paid for 50% solar export and actually exporting virtually nothing but that was on of the major financial incentives to fit the Powerwall.
One thing is that the meter is recording the 1.3kWh per day demand but not the balancing export from the battery. The smart meter is designed to measure this but EDF haven't activated export monitoring on my meter. If it did, it would not be able to separate out solar and battery export. Presumably when the idea of home batteries supplying the grid becomes a reality, export metering will become commonplace. Of course, In a way I can't complain, since I'm being paid for 50% solar export and actually exporting virtually nothing but that was on of the major financial incentives to fit the Powerwall.
JohnRatsey
Member
For what its worth, my daily smart meter in-home display and Tesla power from grid readings for the past four days are:
25 Nov: Tesla = 9.3 kWh, meter = 9.85 kWh (+5.9%)
26 Nov: Tesla = 8.3 kWh, meter = 8.85 kWh (+6.6%)
27 Nov: Tesla = 6.9 kWh, meter = 7.45 kWh (+8%)
28 Nov (to 9am): Tesla = 7.6 kWh, meter = 7.9 kWh (+3.9%)
The smart meter total is always higher. A key component of the difference is the power trickle to/from the grid as the battery output never exactly matches the load. The difference is smaller so far today as there's still 15 hours of this trickling to go, the main power from the grid being battery charging during the 00.30 to 04.30 cheap power period (Octopus Go tariff). My smart meter does record export power with the cumulative amount being accessible by pressing the 9 button. However, the dominant component of the export amount is solar generation.
I've come to accept the inability of the battery to completely balance the power flows. A much bigger dislike is the lack of control over off-peak charging.
John, your numbers seem to indicate that your Powerwall is in spec, using less than 500Wh/day grid demand. That's much lower than mine. We know that the Powerwall makes small demands from the grid, which it largely exports again (exports don't get recorded on the smart meter). Where are you getting the Tesla figures from - downloading the App data?
Actually, today, which was clear sky sunny here, the meter showed export occasionally. There's an import/export arrow, although it hasn't been set to record the export numbers.
Today I downloaded several instant API outputs directly from my Gateway 2. These should agree with the App. As well as instant power, they report the amounts of total energy imported and exported from installation. Summing the energy change over one hour (during peak period) they reported 7Wh import and 8Wh export. This agrees with the Powerwall App, which typically reports daily Peak rate import of 0.2-0.2kWh and export of a similar amount.
My EDF Energy website login page is finally reporting sensible reasonably up to date information. It confirms an hourly import of about 80Wh, which is what I've been reading from my remote display, so TEN TIMES what the Tesla Gateway is telling me.
However, the interesting thing is that taking the Gateway API output total import values from installation, it agrees to within 2kWh with my meter readings. This, of course, includes only 1 month of Smart Meter numbers and 3 months with the old mechanical meter, which generally recorded zero peak import, to within the 10W resolution of the drum display. Unfortunately I don't have the API output when the Powerwall and Gateway 2 were installed, nearly a month ago, or I could make a more meaning full comparison of the new smart meter with the Gateway figures. I'll keep an eye on this during the next few weeks, any discrepancy should show up in a few days.
In the mean time it will be interesting to see what Tesla Tech has to say about my figures!
John, I've just repeated your comparison. My meter only reads to a resolution of 1kWh. However, the EDF website reports to a resolution of 10Wh, so I've used those figures, which have just become available They are currently not showing every day, and estimating the same as the following day where it doesn't have data. So i've only taken the days where there is real data. My first observation is that I use four times as much electricity as you. This is probably because I power 2x3kW immersion heaters, plus charging a Tesla Model S, both at night of course. I Think, for your percentage figures, you've taken your Tesla figures as unity, so I've done the same. Also, I've also split mine between peak and night figures. The total figures are the sum of those two:
21 Nov: Total: Tesla 43.1 kWh, meter 39.48 kWh (-8%):Peak: Tesla 0.1 kWh, meter 1.39kWh (+1390%) Night:Tesla 43.0 kWh, meter 38.09 kWh(-11%)
22 Nov: Total: Tesla 35.8 kWh, meter 35.59 kWh (-1%):Peak: Tesla 0.2 kWh, meter 1.63 kWh (+815%) Night:Tesla 35.6 kWh, meter 33.96 kWh(-5%)
24 Nov: Total: Tesla 26.8 kWh, meter 25.31kWh (-6%):Peak: Tesla 0.2 kWh, meter 1.71 kWh (+855%) Night:Tesla 26.6 kWh, meter 23.6 kWh(-11%)
The Total figures can be compared to yours, and at first glance, my meter is under-reading compared to the Powerwall. However, this disguises the fact that the (expensive) Peak meter readings are grossly larger than the Powerwall readings, whereas the (cheap) night readings are lower than the Tesla readings.
The net result is that during the Peak period, my meter is accumulating much higher import figures than the Powerwall is reporting, and it's costing a much bigger amount than the night amount. It's interesting that the Powerwall is reporting lower consumption than the meter at night. That's rather a puzzle. The total effect is that my Tesla readings are lower than the meter readings, but because of the large difference between Peak and Night rates, it's costing more. There is also significant variation in the difference between the two sources.
JohnRatsey
Member
Given that your consumption is much bigger than mine, measurement errors should be a much smaller percentage of the total. Are you sure that all power flows are measured by the PW's current transformer? In my case the CT is visible and on the cable a few inches from the meter so I know that but are measuring the same.
Your difference between day and night is baffling. Power factor? Tesla's gateway reports reactive power but I wonder what happens if there's a big capacitive load somewhere which pushes the power factor in the other direction (my electrical engineering knowledge is somewhat rusty).
Your difference between day and night is baffling. Power factor? Tesla's gateway reports reactive power but I wonder what happens if there's a big capacitive load somewhere which pushes the power factor in the other direction (my electrical engineering knowledge is somewhat rusty).
Your electrical engineering knowledge may be rusty, John, but it's probably better than mine. I trained as civil engineer so mine is basic high school physics - V=IR and Power =VI for direct current. It wasn't until I looked into why my plugin power meter was apparently recording ridiculously high power drain on a microwave oven that I found out about AC phase angle and power factor. I'm not an IT expert either!
I am not aware of any CT clamps on my system, except non-related ones for my Owl Intuition solar monitoring and an old British Gas remote monitor. I thought that CT clamps measured apparent current, but since most house appliances are electric motors and heating elements with a power factor of unity they normally read fairly accurately. It's things like switched mode power supplies, that we think the Powerwall uses, that mess things up. Interestingly, my British Gas remote meter with CT clamp on the meter tail reads about 400W when the Powerwall is supplying all the house demand and the Smart Meter display is reading about 80W , so presumably the difference is related to the power factor. I presume that the Gateway employes some more sophisticated internal monitoring system, like the Smart Meter. If I type https://x.x.x.x/api/meters/aggregates (where x.x.x.x = IP address of gateway) into my browser I get the instant gateway output as raw data, which includes instant_power, instant_reactive_power and instant_apparent_power, so presumably it's capable of determining the true power consumption which, I understand, is termed 'active power'.
I'm not quite sure what you mean between 'difference between day and night readings'. My powerwall is generally providing all my house demand during the day, so the meter should record nearly zero demand, like the 0.1-0.2kWh the Powerwall is showing on the app, instead of the 1.3-1.5kWh it's actually recording. At night I will obviously be drawing a large demand from the grid to recharge the powerwall and run the house demand.
But quite why my night and total readings are higher than the Tesla app readings is a mystery to me. I would have thought it should be the other way round, like your total readings.The figures I gave yesterday for 3 days readings seem to indicate that overall I actually used (metered) ~5kWh more than the Powerwall App recorded. That suggests that my smart meter meter is logging a lower total demand than I'm actually using, so in that sense I'm ahead. The problem is that most of the 5kWh is at a very cheap price, but where it's apparently over-reading, during the day, I'm paying through the nose at a very expensive rate. If those figures are approximately correct, it may be a case of swings and roundabouts. Calculating the plus and minus costs and extrapolating my 3 days to a year it only works out at an additional cost of about £23 rather than the £150+ that the Peak over-read is costing, so perhaps I shouldn't complain.
Have I made an error somewhere? I'll check my calculations. Well, wiggly amps were never my best subject!
sashton
Member
@JohnRatsey A much bigger dislike is the lack of control over off-peak charging ?
It really depends on what level of control you're looking for.
It seems to play ball with static on/off peak quite well but my issue was trying to get it to work effectively with half hour metering like Octopus Agile.
Changing mode with the https://owner-api.teslamotors.com usually worked on setting the advanced mode but with the charge rate sometimes being 3.5 kW and sometimes being 5kW (for reasons that were beyond me) jumping in and setting the mode back to self-powered often took over 30 minutes.
This was a royal pain as I had done all the coding to work out how much power was needed during the night based on expected demand and expected solar gain the following day > how many half hour periods were required > pick the cheapest periods … I just could not get the battery to play ball fast enough.
The issue became moot when the Octopus Agile prices flattened out in the Autumn/start of Winter so I switched back to Octopus Go.
A few weeks later 1.41.2 was applied and I noticed the latency in applying the changes seemed to disappear. It could have been a server change or the f/w change but since that time the delay seems to have gone.
Hopefully Octopus Agile prices should improve in the spring then I'll switch back and be able to get the battery to react efficiently to their price plunges.
@sashton, you're right, in the UK we would all like to see more control over Powerwall night charging. The Gateway algorithm currently seems to assume that tomorrow's solar insolation will be the same as today's - fine for California, which has wall to wall sunshine! Not fine for UK where 3 fine days are followed by an abysmal cloudy rainy day. Then the Powerwall doesn't charge enough and runs out of power. It should be quite simple to incorporate forward forecasting. There's a whole industry devoted to this and I can do it manually using predicted hourly local solar insolation from a paid for aviation forecasting website. There have been rumours that the Powerwall will be able to do this but it doesn't at present.
When first installed, my time zone, it turned out, was set to Berlin time and the advanced cost saving mode didn't appear for 8 days, until I complained and they found the problem. During that time I increased the reserve value to force it to charge when a rainy day was forecast. That worked, but it'e not practical as a regular thing. I did notice that to took anything between half an hour to over 2 hours to implement the change in reserve. Since they sorted the time zone out I've accepted that occasionally it would run out of charge. It's actually much better at this time of year as it's charging to 100% every night.
You mentioned that since 1.14.2 was applied the latency seems to have disappeared. I hope so! If I experiment with changing to self powered mode during the day to eliminate the phantom power drain that I am experiencing, that could be quite important. However, that ploy is also not really practical as a regular option.
The Powerwall API reports instant power, reactive power and apparent power. Having just read up about AC power, S^2 = P^2 + Q^2. So if you take the square root of (apparent power^2) minus (reactive power^2) you get real instant power. That works out fine for the API reported values, so the Gateway appears to be able to measure and take power factor into account. The problem is that the API reported Real Power, usually ±2-3 watts, is far less than the constant 80 watts that my smart meter is recording!
PS - I was wrong about freezers being straightforward to measure the power - apparently, compared to light bulbs and cooker rings - and I quote:
".... things like fridges, washing machines, pillar drills and arc welders are not so straightforward as these appliances take in a certain amount of energy, then release some energy back into the mains supply. These have inductive (e.g. motors) or capacitive (e.g. arc welders) components in addition to the resistive component."
Oh well, I think I've got more boning up to do!
sashton
Member
I'm sure there are many pay-for services which will calculate your solar yield for the following day but I am still struggling up a steep learning path trying to get an approximate figure using the various free weather services that are out there.
My first attempt was using api.openweathermap.org and merging their three hour "cloudiness" prediction with the average yield that month. It was complete shite and no matter how many adjustments I made it was not uncommon for my predictions to be 50% off.
I then switched to api.darksky.net using their hourly cloud cover prediction and merged that with output from the Smithsonian formula for clear sky insolation and although far from perfect it is getting close to useful.
With my luck I will just about get it working and Tesla will deploy a model that actually works for the UK.
JohnRatsey
Member
@sashton : Your ambitions for charge management are far greater than mine - I'd looked at the Octopus Agile tariff and concluded that in the winter months it might not give much financial saving. I'll be happy to have a simple slider control which gives the battery limits for the range of off-peak charging. At this time of year Tesla's algorithm is almost OK as the daily solar generation range isn't big (I'd like the ability to tell the battery to fully charge if there's the possibility of snow as that kills the solar output completely - I don't have the backup gateway). It's spring and autumn when the range in daily solar generation is much larger and absence of any forecasting means the battery more frequently gets the charging wrong by a financially significant amount.
JohnRatsey
Member
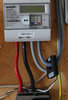
@mikemillar: Here's a photo showing the current transformer on my mains supply so you know what they look like. They are normally hidden in the consumer unit (as is mine for the solar generation) but I recall that it would have been too much of a squeeze to fit the mains CT in there so it was put outside. Consequently I have no doubt about what it's measuring. If you feel confident with a screwdriver (preferably insulated) then you could look inside your consumer unit.
And I wait to see if my battery will get though Friday. There have been several sunny days and the amount of off-peak charging is dropping but Friday is forecast to be cloudy and drizzly.
And I wait to see if my battery will get though Friday. There have been several sunny days and the amount of off-peak charging is dropping but Friday is forecast to be cloudy and drizzly.
Attachments
Thanks John. At present I've got 3 CT's in a similar position to yours. 2 are for my immersion heater power diverters and one is for an old British Gas remote display. That one is clearly reading apparent power as it's showing several times the new Smart Meter remote display power. I also have 3 of them related to my Owl Intuition grid and solar monitoring system, but these clamp onto different cables. None are in the consumer unit.
Via my PVOutput community forum I've just been pointed to a rather useful Arduino website which tells you how to set up an Arduino connected to a CT and measure real RMS current and voltage and hence real power. I'm guessing that it sould show the same instant power as the Smart Meter remote display. I've got an Arduino so I hope to give that a try. I'm not a programmer, but the code is available, so that should keep me busy over the winter!
Via my PVOutput community forum I've just been pointed to a rather useful Arduino website which tells you how to set up an Arduino connected to a CT and measure real RMS current and voltage and hence real power. I'm guessing that it sould show the same instant power as the Smart Meter remote display. I've got an Arduino so I hope to give that a try. I'm not a programmer, but the code is available, so that should keep me busy over the winter!
I'm still trying to understand what's being measured by my Smart Meter, but it's beginning to look like Smart Meters may measure power in a different way to analog meters. This forum is rather illuminating:
How do residential analog and smart meters measure power?
It 's about US meters but UK meters are probably the same. According to this source, domestic analogue meters measure 'real power' and do not take the power factor into account. Commercial ones do. This is because traditionally most home loads have been resistive, with a power factor of 1. However, Smart Meters are capable of measuring the power factor. Switched mode power supplies, and the Powerwall almost certainly has one of these, generally have a power factor much less than One. I've estimated 0.25 for mine. That probably means I'm paying for the power factor as well as Real Power, now that I've had a Smart Meter fitted.
If the above is correct, my conclusion is Don't have a smart meter fitted if you have a powerwall!, or accept that your electricity saving is going to be less than you expected.
The question still arises - why is the Powerwall taking so much power from the grid when it's supplying the house?
Similar threads
- Replies
- 2
- Views
- 653
- Replies
- 11
- Views
- 872
- Replies
- 0
- Views
- 412
- Replies
- 4
- Views
- 319
- Replies
- 2
- Views
- 735