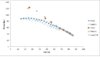
The graph posted above is real world data. However, there is considerable debate among some TMC members whether there is a difference in maximum charge rate taper. The point of contention is when do B, D, and now E packs cross the 90 kW threshold? See a related thread here where we tried to sort it out:
Supercharging Taper Curve for D+ Pack
I would love to overlay my chart with reliable data sets (and with sufficient time resolution) that people send me of their SpC sessions. Many Visible Tesla graphs suffer from too low time resolution such that it is not clear when the line intersected a certain kW output.
Side Note: we don't have any evidence of the C pack existing in the wild.