While dealing with my Tesla solar roof's production issues, I wondered how much annual variability people experience with their roofs/panels. It would be interesting to see min, max, and median annual kWh values for folks who have had solar for a while (more than a couple years). As a bonus, it would also be interesting to see Tesla's annual estimate value to get a sense of where the estimate fits with reality.


Welcome to Tesla Motors Club
Discuss Tesla's Model S, Model 3, Model X, Model Y, Cybertruck, Roadster and More.
Register
Install the app
How to install the app on iOS
You can install our site as a web app on your iOS device by utilizing the Add to Home Screen feature in Safari. Please see this thread for more details on this.
Note: This feature may not be available in some browsers.
-
Want to remove ads? Register an account and login to see fewer ads, and become a Supporting Member to remove almost all ads.
You are using an out of date browser. It may not display this or other websites correctly.
You should upgrade or use an alternative browser.
You should upgrade or use an alternative browser.
How much has your solar production varied year to year?
- Thread starter trautmane2
- Start date
MX100DM3P2017
Member
I installed 7kWh system with Sunrun almost 9-years ago. Here is my annual production. I live in Los Angeles so weather is pretty much sunny all year long. Note for Yr7, we had a lot of smoke from fires in the area during the summer.
Annual Solar Production from Sunrun 7kWh system, installed March 2014
Yr1 13,126
Yr2 13,020
Yr3 12,509
Yr4 12,460
Yr5 12,588
Yr6 12,473
Yr7 12,252
Yr8 12,705
Yr9 pending
Annual Solar Production from Sunrun 7kWh system, installed March 2014
Yr1 13,126
Yr2 13,020
Yr3 12,509
Yr4 12,460
Yr5 12,588
Yr6 12,473
Yr7 12,252
Yr8 12,705
Yr9 pending
charlesj
Active Member
Steve2498
Member
While dealing with my Tesla solar roof's production issues, I wondered how much annual variability people experience with their roofs/panels. It would be interesting to see min, max, and median annual kWh values for folks who have had solar for a while (more than a couple years). As a bonus, it would also be interesting to see Tesla's annual estimate value to get a sense of where the estimate fits with reality
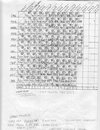
My production has been pretty consistent over the years. 1st set of panels installed 3/09, second set installed 11/19. Attached is the graph...
Attachments
Thanks! If/as others post, I'll add to a spreadsheet like this:

My use case is/was to get a sense whether production for newer (one or two year old) installs is far enough below the target annual estimate to be confident you have a production problem.
Comparing the min divided by estimate value for a new-ish install to the long term min divided by max values seems like it might be useful for this.
roblab
Active Member
11 kw of solar, but I never ever ever worried about keeping charts or graphs. I figure the power my panels have produced hasn't paid for the cost of the panels yet, much less the cost of those power walls. Some things just aren't ever going to pay off. I got solar and Power Walls to do my part to fight global warming, little though it is. You folks that like to play with charts and graphs can enjoy spending time showing off your work.
As to how much that production has varied year to year, why would that matter? Most California years are sunny. It should vary little.
As to how much that production has varied year to year, why would that matter? Most California years are sunny. It should vary little.

The reason I asked (and why it maters to me) is because my system has had a "moderate" production problem since its installation 2 years ago that has been difficult to confirm. It is relatively easy to know you have a problem when an inverter completely fails or if you see a recurring pattern of sharp drops in production on cloudless days. However, my issue was harder to confirm since I was getting moderately less production (25%-ish less) than I should without any obvious culprits. Day-to-day and even month-to-month, I could not be sure if weather variability was causing lower production or if there was a system problem.As to how much that production has varied year to year, why would that matter?
I appreciate your general sentiment of "don't waste your time obsessing over return on investment". In my case, I'm not worrying about return on investment as much as just wanting the system to work properly. I admittedly can be obsessive about details, so you've got me there
") .
.I find it very interesting that at least anecdotally here so far, annual production is pretty constant.
So if your annual production is more than 5% or so below median (or a good install estimate), that might be a good indicator that you have a system problem.
buckets0fun
Active Member
Interesting take.11 kw of solar, but I never ever ever worried about keeping charts or graphs. I figure the power my panels have produced hasn't paid for the cost of the panels yet, much less the cost of those power walls. Some things just aren't ever going to pay off. I got solar and Power Walls to do my part to fight global warming, little though it is. You folks that like to play with charts and graphs can enjoy spending time showing off your work.
As to how much that production has varied year to year, why would that matter? Most California years are sunny. It should vary little.
Many of us have found that our Powerwalls and Panels reached breakeven a few years in. Sorry to hear that yours will never pay off.
MX100DM3P2017
Member
Agree. Installed solar March of 2014 and broke even December of 2017. Profit to me now $12,703 based on utility electric rates from 2014 which were $0.125kWh for Tier 1. Tier 1 rate is now $0.29kWh so my savings are much greater. I also replaced two ICE vehicles with two Teslas in 2018. In 2013, the last year I was buying gas at $3.49 a gallon for two ICE vehicles, $7K annual gas bill for ICE. Now $0 so savings back to me is even greater. Nothing better than investing in yourself while helping to save the planet. With electric rates climbing and premium gas now at $7.08gallon in my area, I have no idea how anyone could not at least break even.Interesting take.
Many of us have found that our Powerwalls and Panels reached breakeven a few years in. Sorry to hear that yours will never pay off.
Similar threads
- Replies
- 10
- Views
- 2K
- Replies
- 14
- Views
- 2K
- Replies
- 9
- Views
- 1K
- Replies
- 8
- Views
- 2K