Welcome to Tesla Motors Club
Discuss Tesla's Model S, Model 3, Model X, Model Y, Cybertruck, Roadster and More.
Register

Interesting driving stats thread

This site may earn commission on affiliate links.
Nice one @ittah Mine, which is essentially the same car in the same location and climate looks like this.

upload_2021-2-26_21-37-14.png

This might suggests driving style and where we drive has a fair bit to do with it. Predominantly country driving for me. @ittah is your driving somewhat focused on urban areas perhaps? They both show similar negative effects of temperature extremes though. Just that you are markedly more efficient. Be interesting to see what your lifetime average speed is? Mine is 75KMH. Telsafi does not show this figure directly, but if you go to Lifetime map and look in the top line it displays kms driven and "Times spent driving" in days & hours. Convert the latter to hours & divide km driven by this figure.
 
Do not use sentry mode while parked for two days as it uses ~6% a day.

I thought that seemed a bit high when I read it, so I did a test last week when I had to leave my car at the airport.

My car is a Model 3 Performance, 1 year, 3 months old and I turned off Cabin Overheat Protection when I parked it. I arrived on Monday at 10:00 am with 65% and returned on Friday at 11:30 am with 42%. That works out to be roughly 5.75% per day.

Unfortunately I didn't take screen shots each day, but I did notice a big drop (nearly 10%) on the first day compared to the remaining days. There were only 5 sentry events when I returned.

Hopefully the next hardware revision (including the cameras) draws less power for sentry mode.
 
  • Informative
Reactions: Vostok
...This might suggests driving style and where we drive has a fair bit to do with it. Predominantly country driving for me. @ittah is your driving somewhat focused on urban areas perhaps? ..<snip>.. Be interesting to see what your lifetime average speed is? Mine is 75KMH. Telsafi does not show this figure directly, but if you go to Lifetime map and look in the top line it displays kms driven and "Times spent driving" in days & hours. Convert the latter to hours & divide km driven by this figure.
It does now. I made the suggestion to Teslafi and they have added lifetime average speed. Suggested yesterday, implemented today. That was quick. So now when we compare two similar cars we can relate lifetime Wh/km & Efficiency to Lifetime Avg Speed & Avg temp.

upload_2021-3-3_9-6-44.png
 
  • Informative
  • Helpful
Reactions: Hairyman and Vostok
It does now. I made the suggestion to Teslafi and they have added lifetime average speed. Suggested yesterday, implemented today. That was quick. So now when we compare two similar cars we can relate lifetime Wh/km & Efficiency to Lifetime Avg Speed & Avg temp.
Wow, a lifetime average speed of 75 km/h is nuts. You clearly don’t live in a city. The lifetime average speed in our Nissan Leaf is a miserable 24 km/h!
 
Wow, a lifetime average speed of 75 km/h is nuts. You clearly don’t live in a city. The lifetime average speed in our Nissan Leaf is a miserable 24 km/h!
Yeah. I think that is partly why my Wh/km is comparatively poor. Higher speeds and cooler temperatures ruin the efficiency.
Temperature is the real killer. Here is another comparison of two drives over the same 211km route that I posted last week. This time, you can see the avg speed and time is identical, to within a minute. Both trips I started off with ~55% charge after having been parked for two days. However the efficiency on the two drives varies by 22% ! (117Wh/km vs 145Wh/km). The two things that changed and appeared to cause the increased consumption were the outside temperature being 7.4 c colder and I had the AC ON Auto and set to 21 C.

upload_2021-3-3_17-59-34.png
 
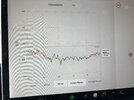
Another interesting feature I hadnt previously noticed on Teslafi is speed efficency:
View attachment 666705
Interesting, but what TeslaFi calls “efficiency” is not a parameter I would consider to be “efficiency” or any proper metric related to it. My understanding is that it is just a relative measure of how accurate the remaining range estimate is (100% means the distance you travelled equals the range reduction shown on the battery icon). Your chart suggests is it is pretty accurate regardless of speed. So, that’s good and nice to know, but we should expect that to be the case if the remaining range indicator is to serve any useful purpose. Otherwise it’s just a random number generator (akin to the Nissan LEAF’s “guess-o-meter”) and not useful.

I’d like to see a chart of Wh/km (true efficiency) versus speed bucket.
 
That curve is surprisingly flat over such a large range of typically encountered speeds.
Good point. Had not noticed that.
Another Telsafi feature is the ability to pull the data in the middle of a drive. My wife is on a 180km drive in our Model 3 to where I am located as we speak. I can see in Teslafi with the drive almost complete she is averaged 168 Wh/km and 74kmh. Cold wet night drive.
@Vostok My low speed driving would be stop start around town.