RTPEV
Active Member
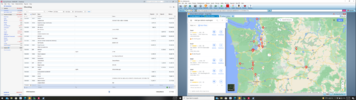
You need to pop up the Trip Energy Consumption graph and just watch it during the trip.My wife and I are getting more comfortable stretching the range than early on. Have run down to the mid-20s on our recent trip. I would push further but my wife gets nervous at 30%. Our first trip she got nervous at 50% so we are making progress.
This will show you the predicted SOC at the end of the trip and additionally show you how you are doing (the green line) versus how the car originally predicted (the gray line). If you consistently stay near or above the line (like shown above), you can trust your driving and the car's ability to predict SOC accurately (or at least pessimistically, which is what you want). The more you watch this, the more confidence you will have.
Of course if you ware watching it and the line is BELOW the gray line, you may need to figure out what is going on and adjust your plan (maybe the roads are wet, or there is a strong headwind, or you are towing something, or just driving like a madman!)