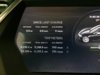
Welcome to Tesla Motors Club
Discuss Tesla's Model S, Model 3, Model X, Model Y, Cybertruck, Roadster and More.
Register

Lifetime Average Wh/mi

This site may earn commission on affiliate links.
Update for Wh/mi
tesla1.JPG
tesla2.JPG


34k - A is since last tire rotation, B is total miles on car - P85, blue, black leather, tech, pano owned since 1/13 - mine
19k - A is some random point in past, B is total miles on car - S60 blue, tan leather, tech, pano - wife's car
 
After a little more than one year, I'm at 9800 miles and an energy use of 296 Wh/mi. This is mostly commuting in fair weather (Northern California: we did not have a winter this year), with speeds rarely exceeding 60 MPH. Very low use of climate control. Just got the 5.9 update and it looks like it may be lowering the reported Wh/mi; time will tell.

Except for two Supercharging sessions, all my charging is done using the UMC at 40A (14-50 outlet) starting at 2AM to minimize the time the battery stays in a high state of charge. I did not change the default normal charge level set by the various versions of the firmware (around 80%, I guess).
 
To recap, our red S85 (P19743) arrived 09/18/2013. In just over six months, we drove it 10,878 miles using 4,062 kWh at an average of 373 Wh/mi. At that point we were driving at a rate of about 20,000 mi/yr.

Then in March 2014, we took a long trip from Oregon-Texas of 1,996 miles using 690 kWh at an average of 346 Wh/mi.

Then we returned April 2014 from Texas-Oregon (2,230 miles, 733 kWh, 329 Wh/mi).

Since returning home to our normal pattern, we have driven 424 miles using 143 kWh at 337 kWh.

So our 7-month total as of 04/19/2014 (reported earlier) is 15,528 miles using 5,628 kWh at 362 Wh/mi. At this rate, we will drive about 26,600 miles in our first year.

As you all know, it is sure fun to drive! Martha and I are thoroughly enjoying our first new car (in our 37 years together).
 
Thanks everyone for updating your numbers!

We now have almost 2.5 million miles worth of data with a huge variety of driving conditions and driving styles.
It has taken me much longer than I hoped to put the final numbers together because I'd like to include some plots
of monthly wh/m through time, and that took a bit more work, but I hope to have something out shortly.

If anyone who has not updated in a while wants to do so,now is a good time. Or if there are other people who have relatively long records (monthly or total) who want to add their numbers that would be great too.
 
Thanks again to everyone for updating their numbers. A good time to get another update would be the end of
September, after the summer.

I've attached 2 files. One is an excel file containing the raw data and the other is an (unpolished) pdf file with some plots and summaries of the data.

I'm sure I made some errors when copying people's data. If you see any, let me know.

Any other comments, criticisms, or suggestions are welcome.
 

Attachments

  • teslawhm201404.pdf
    389.6 KB · Views: 151
  • teslaMS.xls
    84 KB · Views: 76
Thanks again to everyone for updating their numbers. A good time to get another update would be the end of
September, after the summer.

I've attached 2 files. One is an excel file containing the raw data and the other is an (unpolished) pdf file with some plots and summaries of the data.

I'm sure I made some errors when copying people's data. If you see any, let me know.

Any other comments, criticisms, or suggestions are welcome.
WOW! nice work Jeff! thanks for all your hard work on this.
 
You are right. Just made the effort to give Jeff some good rep (whether he cares about the green ingots or not :)).

Thanks guys! I think I actually had 2 bars for about a week, but quickly lost them as people thought better of it. Comedy.

Putting the data into a spreadsheet was quite tedious as you might imagine, but I actually learned quite a few interesting things (to me) doing the analysis.
For example, trying to figure out why the mileage in Oregon and Washington is so bad, I learned to my surprise that Portland and
Seattle get about as much rain as Chicago and less than Boston. I had thought they got way more. That and I finally figured out how to make
trellis graphics. So the exercise was worthwhile for me...

I think my reputation comment just pushed you over the threshold to two bars. Great work! Thanks!!!
 
Aw, you missed my update on April 7.
Now (April 7, 2014) up to 319 Wh/m with 14,900 miles; S85 19" wheels.

It went back and forth 319/320 a few times. Now that the spring weather has caught up with the official season, I expect to "drive down" that number. I'm daily averaging below 300 again.
Winter average was around 360 for a while!
I'll try to update more often, like monthly. BTW I was right, my number is already looking better - faster than I expected.

It's fascinating looking at your work. You can nearly predict where someone's from (latitude) looking at those graphs!

Today: 16,243 miles, 315 Wh/m. Down 4 full points in just 2 weeks.
 
Sorry for the late response but here's some additional data.
DateAvg EnergyDistanceStateModelTire


8/27/1337212057CAP8521
9/17/1337113664CAP8521
10/18/1337114964CAP8521
11/2/1337216224CAP8521
11/30/1337117511CAP8521
12/20/1337018484CAP8521
1/1/1437119749CAP8521
2/1/1437121765CAP8521
3/1/1437122888CAP8521
3/30/1437124474CAP8521
4/22/1437124791CAP8521
Is that the avg per month or the cumulative average?