Welcome to Tesla Motors Club
Discuss Tesla's Model S, Model 3, Model X, Model Y, Cybertruck, Roadster and More.
Register

Low Solar Production and Peak vs Rated

This site may earn commission on affiliate links.
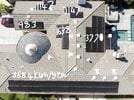
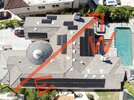
I have a new 8.4 Kw Tesla Solar Panel system (21 panels) with 2 PW+. It's been up and operational for over 2 months. The peak solar production I've ever seen this system produce is 5.6Kw and a total of 35.6Kwh so far. I live in Texas and we've had some pretty good sunny days and this is the peak I've seen this system generate. Is this normal? There are no obvious obstructions and the system is facing South (13 panel string) and West (8 Panel string).

I used PyPowerwall to start digging into see if both strings are generating power properly and this is what I got from the string data:

JSON:
{'A': {'Current': 9.11, 'Voltage': 271.2, 'Power': 2449.0, 'State': 'PV_Active', 'Connected': True},

 'B': {'Current': 9.01, 'Voltage': 270.3, 'Power': 2400.0, 'State': 'PV_Active_Parallel', 'Connected': True},

 'C': {'Current': 0.0, 'Voltage': -1.0, 'Power': 0.0, 'State': 'PV_Active', 'Connected': False},

 'D': {'Current': 0.01, 'Voltage': -1.299999999999999, 'Power': 0.0, 'State': 'PV_Active', 'Connected': False}

 }

Is it normal for the state of the second string to be 'PV_Active_Parallel'? Some of the other discussions I've seen on this forum have state as 'PV_Active'. Anyone familiar what parallel means for state of the string? And if this string data makes sense to you?
 
Solution
Tesla finally was able to come and check this. They were able to locate one of the 'disconnected' strings and were able to quickly fix it. Energy production is now in the expected range. I now see power from all the three strings.

Thanks everyone.
!!! Can you describe your panel config on your roof? With that many panels I’m assuming it must be several arrays on different sections, but your production seems extremely low regardless unless you have some serious shade issues or none of your panels face in even a moderately optimal direction.

I have a 9.6Kw system and in optimal months of May-Jul etc for sun angle I hit the 7.7 Kw max inverter cap for often 4 hours a day and often get close to 70Kwh a day. It was enlightening for me though that super sunny days at the height of summer produced less solar than in spring/early summer, because heat has a much greater effect on production than I thought, sunny cold days with decent sun angle were always the best by far! (spring) I’m in SF bay area and my panels are all south facing.

If you have 7.6 + 3.8 inverters there is no way (barring bad installation) that you’re capped at 6Kw production. I’d love to see a pic of your panel/roof situation.
Hi, this is the pic of my panels and the inverter, they came and did something and the production went up to 35kwh/day and the peak at 6.7kw. But still for a system of 14kw i believe is very low. I live in SO CAL, lots of sun. Any idea is greatly appreciated. Thanks
 

Attachments

  • IMG_1459.jpg
    IMG_1459.jpg
    74.5 KB · Views: 86
  • IMG_1460.jpg
    IMG_1460.jpg
    66.2 KB · Views: 43
  • IMG_1464.jpg
    IMG_1464.jpg
    97.9 KB · Views: 44
  • IMG_1465.jpg
    IMG_1465.jpg
    99.7 KB · Views: 45
  • IMG_1478.jpg
    IMG_1478.jpg
    221.5 KB · Views: 50
Upvote 0
Which way does your house face? It might be due to the various panel orientations.

The wiring looks correct from what I can tell based on roof picture and the voltage/current readings.

3.8kW inverter string 1 has 4 panels in series (probably the two pairs of panels at the top of the pic); string 2 has 8 panels in series (the set of 8 panels on the right side of the picture)

7.6kW inverter string 1 has 3 panels in series (the only set of 3 panels on your roof); string 2 has 2 panels in series (the set facing that circle roof thingy); string 3+4 are two strings of 9 panels in series (the group of 18 panels in bottom of picture).

The 18 panels on string 3+4 aren't producing much more than the set of 8 panels (1750W vs 1500W). Could be a wiring problem in which half the pair aren't connected, or their orientation is not ideal.

You can enter those sets of panels independently into PVWatts to get an estimate of what they're supposed to produce.
 
  • Like
Reactions: Sam88
Upvote 0
Which way does your house face? It might be due to the various panel orientations.

The wiring looks correct from what I can tell based on roof picture and the voltage/current readings.

3.8kW inverter string 1 has 4 panels in series (probably the two pairs of panels at the top of the pic); string 2 has 8 panels in series (the set of 8 panels on the right side of the picture)

7.6kW inverter string 1 has 3 panels in series (the only set of 3 panels on your roof); string 2 has 2 panels in series (the set facing that circle roof thingy); string 3+4 are two strings of 9 panels in series (the group of 18 panels in bottom of picture).

The 18 panels on string 3+4 aren't producing much more than the set of 8 panels (1750W vs 1500W). Could be a wiring problem in which half the pair aren't connected, or their orientation is not ideal.

You can enter those sets of panels independently into PVWatts to get an estimate of what they're supposed to produce.
Thanks for your reply. I did not know you get so much info just from the pics. Here are the pics that you asked for. These are the estimates from the PVWatts for each set. Thanks a lot again for your help.
 

Attachments

  • IMG_1478.jpg
    IMG_1478.jpg
    228.7 KB · Views: 37
  • IMG_14781.jpg
    IMG_14781.jpg
    308.2 KB · Views: 40
Upvote 0
I can piece together some of the puzzle, but I not if that 18 panel group is producing what it should or not.

The only thing I can suggest is to track monthly production of your entire system and see if it matches PVWatts. If you’re missing 8/35 panels, I’d guess the difference would be easy to see.

Maybe someone else will know if it’s possible to download the data from the inverter, and then see if string 3+4 is making what it should based on PVWatts monthly production estimate divided by 31 days/month in Oct.
 
Upvote 0
Hi, this is the pic of my panels and the inverter, they came and did something and the production went up to 35kwh/day and the peak at 6.7kw. But still for a system of 14kw i believe is very low. I live in SO CAL, lots of sun. Any idea is greatly appreciated. Thanks
You have very sub-optimal orientations (azimuths) of your panels because of your roof configuration. It looks like the panel placement is about as good as it can get, so I wouldn't blame the layout and production on the installer. I have similar problems with my roof and the majority of my panels are in the northwest and northeast directions like you have.

I plugged your data in the PVwatts.nrel.gov calculator using a location of "Orange County, CA" as your profile indicates and it resulted in the following for each of your panel groups.
PanelsDC
kW
Azimuth
Degrees
PVWatts
kWh/year
Your
Image
kWh/year
ScalingPVwatts
kWh for
10/26 @ Noon
Scaled
kWh
18+28.04510,0309,66796.4%2,6972,599
31.21351,9541,63883.8%746625
2+21.62252,7182,29484.4%1,131955
83.23154,2453,77088.8%1,3871,232
3514.018,94717,3695,9615,411

I don't know what time you took the inverter data photos, so I picked noon on the day that you posted them. One of the inverters was 2,700W and the other was 3,170W for a total of 5,870W. This lies in-between the raw PVwatts number of 5,961W and the scaled 5,411W, so I think that your system is working as expected.

@jjrandorin If you ever have moderator meetings for improvements can you please lobby for better table editing? The above looks horrible, but I'm tired of have to do cell-by-cell alignment setting to fix the formatting.
 
  • Like
Reactions: BGbreeder and Sam88
Upvote 0
You have very sub-optimal orientations (azimuths) of your panels because of your roof configuration. It looks like the panel placement is about as good as it can get, so I wouldn't blame the layout and production on the installer. I have similar problems with my roof and the majority of my panels are in the northwest and northeast directions like you have.

I plugged your data in the PVwatts.nrel.gov calculator using a location of "Orange County, CA" as your profile indicates and it resulted in the following for each of your panel groups.
PanelsDC
kW
Azimuth
Degrees
PVWatts
kWh/year
Your
Image
kWh/year
ScalingPVwatts
kWh for
10/26 @ Noon
Scaled
kWh
18+28.04510,0309,66796.4%2,6972,599
31.21351,9541,63883.8%746625
2+21.62252,7182,29484.4%1,131955
83.23154,2453,77088.8%1,3871,232
3514.018,94717,3695,9615,411

I don't know what time you took the inverter data photos, so I picked noon on the day that you posted them. One of the inverters was 2,700W and the other was 3,170W for a total of 5,870W. This lies in-between the raw PVwatts number of 5,961W and the scaled 5,411W, so I think that your system is working as expected.

@jjrandorin If you ever have moderator meetings for improvements can you please lobby for better table editing? The above looks horrible, but I'm tired of have to do cell-by-cell alignment setting to fix the formatting.
That is a detail calculation, thank you, I did not know how to calculate Azimuth for each set of panels. Yes I am in orange county, CA. So basically I should expect somewhere around 85% of estimated Tesla production. I wish I knew these info before deciding to install the system. But thank you.
 
Upvote 0
That is a detail calculation, thank you, I did not know how to calculate Azimuth for each set of panels. Yes I am in orange county, CA. So basically I should expect somewhere around 85% of estimated Tesla production. I wish I knew these info before deciding to install the system. But thank you.
You are misinterperting the scaling column. This is the PVwatts estimate divided by the number that you wrote on your roof image. Your numbers, which I think are Tesla's numbers, are all less than the PVwatts estimates. So the 85% factor is a de-rating of the PVwatts not the Tesla numbers and it looks like you might be getting better results than what Tesla estimated for the system, not less, as the real world was 5,870W versus my estimate of 5,411W.

Please keep in mind that I based the azimuths off of the East-West line that you drew on your roof photo and left all of the other PVwatt settings at the defaults including roof tilt (20%) and system losses (14.08%). Also, all of these estimates use historical weather data so there can be wide variation between the PVwatt estimate and actual for a single hour of a single day.

How your roof configuration impacts the panel placement and daily/annual production should be something that every installer educates their customers on, but this never happens. Later the owner of 14kW system that is split east/west compares notes with an owner of a 14kW system all facing south and thinks that something is horribly wrong with their system.
 
Upvote 0
That is a detail calculation, thank you, I did not know how to calculate Azimuth for each set of panels. Yes I am in orange county, CA. So basically I should expect somewhere around 85% of estimated Tesla production. I wish I knew these info before deciding to install the system. But thank you.
I think the yearly power production estimate in your contract should take into account the design of the system, your roof, and orientation of your panels. Does it match what PVWatts says or the table above says?

Those 18 panels make up half the system but face northeast, which is close to the worst direction unfortunately.
 
Upvote 0
You have very sub-optimal orientations (azimuths) of your panels because of your roof configuration. It looks like the panel placement is about as good as it can get, so I wouldn't blame the layout and production on the installer. I have similar problems with my roof and the majority of my panels are in the northwest and northeast directions like you have.

I plugged your data in the PVwatts.nrel.gov calculator using a location of "Orange County, CA" as your profile indicates and it resulted in the following for each of your panel groups.
PanelsDC
kW
Azimuth
Degrees
PVWatts
kWh/year
Your
Image
kWh/year
ScalingPVwatts
kWh for
10/26 @ Noon
Scaled
kWh
18+28.04510,0309,66796.4%2,6972,599
31.21351,9541,63883.8%746625
2+21.62252,7182,29484.4%1,131955
83.23154,2453,77088.8%1,3871,232
3514.018,94717,3695,9615,411

I don't know what time you took the inverter data photos, so I picked noon on the day that you posted them. One of the inverters was 2,700W and the other was 3,170W for a total of 5,870W. This lies in-between the raw PVwatts number of 5,961W and the scaled 5,411W, so I think that your system is working as expected.

@jjrandorin If you ever have moderator meetings for improvements can you please lobby for better table editing? The above looks horrible, but I'm tired of have to do cell-by-cell alignment setting to fix the formatting.

We have a moderator only subforum, and I could post your feedback there, but I think it might be better if you create a thread in the site feedback subforum, with examples of what you are seeing / would like to see:


The site owners do actually review things posted there, and it would be better for feedback to come directly from you on what you see / would like to see, rather than me trying to relay it.
 
Upvote 0
We have a moderator only subforum, and I could post your feedback there, but I think it might be better if you create a thread in the site feedback subforum, with examples of what you are seeing / would like to see:


The site owners do actually review things posted there, and it would be better for feedback to come directly from you on what you see / would like to see, rather than me trying to relay it.
I did that back in July and crickets.

I just added a bit more to that thread today.
 
Last edited:
  • Informative
Reactions: jjrandorin
Upvote 0
I did that back in July and crickets.

I will mention it to them.
 
Upvote 0