


Welcome to Tesla Motors Club
Discuss Tesla's Model S, Model 3, Model X, Model Y, Cybertruck, Roadster and More.
Register
Install the app
How to install the app on iOS
You can install our site as a web app on your iOS device by utilizing the Add to Home Screen feature in Safari. Please see this thread for more details on this.
Note: This feature may not be available in some browsers.
-
Want to remove ads? Register an account and login to see fewer ads, and become a Supporting Member to remove almost all ads.
You are using an out of date browser. It may not display this or other websites correctly.
You should upgrade or use an alternative browser.
You should upgrade or use an alternative browser.
March was a great production month
- Thread starter h2ofun
- Start date
I’m surprised your neighbors haven’t knocked on your door hating you that you caused their energy bill to go up?! Some of the folks in the policy sub forum seem to hate solar.
charlesj
Active Member
I had my 10th full March charted, along with all months.
This March was number 6 best March producer here for me. My number 1 March was the 3rd full March in 2015.
Now starting year 11.
This March was number 6 best March producer here for me. My number 1 March was the 3rd full March in 2015.
Now starting year 11.
charlesj
Active Member
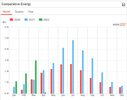
I think some of you may be interested in a 10-year breakdown of monthly solar production
Have two numbers above monthly totals: ranking of month for that year is circled; months ranking compared to another same month, not circled.
Had to allow for leap years for February.
The only thing one can say is how the weather affects production over time.

Have two numbers above monthly totals: ranking of month for that year is circled; months ranking compared to another same month, not circled.
Had to allow for leap years for February.
The only thing one can say is how the weather affects production over time.
I think some of you may be interested in a 10-year breakdown of monthly solar production
Have two numbers above monthly totals: ranking of month for that year is circled; months ranking compared to another same month, not circled.
Had to allow for leap years for February.
The only thing one can say is how the weather affects production over time.
View attachment 791659
Two thoughts…
You must like keeping baseball box scores.
You gotta get Excel.
charlesj
Active Member
Just old fashioned. Like to draw it up and use the lead in my pencil.Two thoughts…
You must like keeping baseball box scores.
You gotta get Excel.

Wow. This great. Seeing your data going back to 2012 makes me wish we got solar much earlier.I think some of you may be interested in a 10-year breakdown of monthly solar production
Have two numbers above monthly totals: ranking of month for that year is circled; months ranking compared to another same month, not circled.
Had to allow for leap years for February.
The only thing one can say is how the weather affects production over time.
View attachment 791659
charlesj
Active Member
Time travel.Wow. This great. Seeing your data going back to 2012 makes me wish we got solar much earlier.
solarAddict
Member
charlesj
Active Member
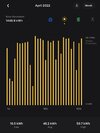
While this is April, no need to start a new thread.
Almost at end of daylight and production looks very good indeed.
Have 11 Aprils and right now the production is 676 kWh with no real chance for mush more as fog is coming in.
AND, this April is the 2nd best of 11 Aprils. 2013 was 689 kWh.
Yep, it is all about the weather.
Almost at end of daylight and production looks very good indeed.
Have 11 Aprils and right now the production is 676 kWh with no real chance for mush more as fog is coming in.
AND, this April is the 2nd best of 11 Aprils.
2013 was 689 kWh.Yep, it is all about the weather.
yblaser
Member
If I'm remembering you correctly your solar is completely south facing. I have the same sized system but split evenly S, W, & E. A bit worse in March and a bit better in April.March and April were almost identical for me. 8.16kW system.
charlesj
Active Member
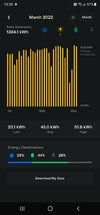
Well, May is finished generating.
Thanks, global warming for a record May production.
This is my 11th May and just became number one in 11 Mays at 734 kWh. Before, the first May was best at 717 kWh followed by year 2 at 711 kWh.
Thanks, global warming for a record May production.
This is my 11th May and just became number one in 11 Mays at 734 kWh. Before, the first May was best at 717 kWh followed by year 2 at 711 kWh.
4.66 MWh, will I hit 5 this year? 187Kwh best day so far, will I hit 190Kwh?

Similar threads
- Replies
- 1
- Views
- 206
- Replies
- 5
- Views
- 142
- Replies
- 20
- Views
- 516
- Replies
- 7
- Views
- 399
- Replies
- 0
- Views
- 199