Welcome to Tesla Motors Club
Discuss Tesla's Model S, Model 3, Model X, Model Y, Cybertruck, Roadster and More.
Register

MASTER THREAD: 2021 Model 3 - Charge data, battery discussion etc

This site may earn commission on affiliate links.
I am not sure exactly how you calculated your capacity, but most likely the method you used also includes the buffer. So that would mean your full battery is 79 kWh, which may be full capacity for your car.
If you want to verify what percent of full capacity you really have, the best way is to just look at your rated miles at 100%, and compare to what the sticker rated range was. I think it was 358 for your car. For example if you have 286 rated miles at 80%, then 286/.80 = 257.5 at 100%. Of course, there is rounding error in that calculation, so the closer you are to 100% charge, the more accurate the calculation will be.

To estimate capacity you use the last 30 miles energy screen, multiply estimated miles remaining by average Wh/mi (on the left and right of the graph) then that gives you Wh at current battery percent. Then you do what you said, divide those miles by capacity in percent remaining.

I thought the 3 kwh buffer was all below 0% which means it wouldn't be included in that calculation and 79 kwh is right where a new M3LR should calculate out to
 
This is posted here, because the I dont see a similar good discussion in the Model Y section and also because the Model 3 Performance is supposed to be released with this drive train pretty soon (Q2/2022 in Europe maybe?)

I have had the chance to do some testing with Nr.15 out of "Giga Berlin". One of the thirty cars delivered and signed by EM himself.

Here are the Performance Results:
cf3892ec19296c6d1c8cd2e43fb22068dcbbdd61.png

177dafa748297541718af71284afdee3c5ad9477.jpeg


  • The Model Y 2022 in Europe is always equipped with the LG Chem 5L 79kWh Battery Pack.
  • The car was Supercharged to 100%. At the Start of the run the car was at 98% SoC / 50°C.
  • The absolute maximum discharge power observed was 416kW. A Panasonic 3L 82kWh would be in the 450kW+ area, which is quite a big difference.
  • As soon as you start driving, you see a drop in the maximum discharge power.
  • Full Power when passing 80kph you see a maximum Battery Power of 410kW, so the car is always battery power limited and starts losing power immediately when you start driving. A M3P 2021 is power limited at around 425-430kW. With a hot pack the battery power limit will be reached at around 75% SoC, not directly at 100% like in the EU MYP.
  • In daily driving at 80% or below there should be no significant power difference to a Long Range with Boost and no difference at all when passing around 120kph.
  • I did an invalid (low sat) Dragy measurement, which was at 4,8s 0-100kph (slope corrected). This should only be regarded as a side note, but I thought it's worth mentioning.
There is a lot going for the Model /3Y Performance in Europe ,but i think in regards to pure Performance this is a step back and the older or US Performance cars will turn out to be faster in general. All due to the choice of battery pack.

Here is a quick diagram to explain the two different power limits.
One from the Battery Pack and one set by Tesla for each product.
The numbers should not be regarded as absolute, but a rough direction so you get the idea an the differences:
7e2bbc48bce601d59394ba29928b17cea4996e6d.png
It would be amazing to have a car signed by Elon...it’s like a personal guarantee...the next time that the SC gives you the runaround...just say, ‘Elon guaranteed this car’👍👍👍👍
 
6.5K Miles so far, 2021 M3LR, no degradation at all so far.

Using Tessie for data logging.

View attachment 788716
It's cool in Newcastle upon Tyne (not as cold as AAKEE's place :))! Do you know what, or have an estimate of, your average SoC has been since new? Looking at the graph you have an NMC M48 battery (5C) like my M3. The graph is quite similar to my M3. I have about 1.4% "apparent" degradation after 4226 Km. I say "apparent" since the NFP values read in SMT change as a function of SoC, resting/storage temperature and use. My NFP reads at about 73.6 kWh average right now.
 
  • Like
Reactions: AAKEE
Not having any degradation at 6k miles is normal. Nevermind that you need to have a few deep discharges to trigger a bms calibration.
The data shown is nice and interesting to see. Looking at the graphs, the battery capacity starts off at the dawn of time with 74 kWh @59 miles (~94 Km) and the app states, 73.8 kWh (top right).

@MichalT and @Candleflame, do you consider that there's no degradation hidden in the graphs shown?

I have several questions. Do you know what battery you have? When did you get delivery in 2021? I thought (right or wrong?) that range is calculated based off the NFP value and a Wh/km value. Does the Tessie data, "battery capacity" represent NFP as per SMT (Nominal Full Pack)?

For the pros here - I understood that the BMS impacts max rated range so does it influence the NFP measurement via OBD from the car? Data and graphs can be misleading.

If you don't want to discuss, or don't agree then that's fine - all this is my pure curiosity, Does it matter if there's a bit of degradation? You see a lot of alarmed posts about 1 mile less here. It's normal. I really enjoy my M3 and my questions come from wanting to understand the car and how the battery works best and how it can be treated best
😎
 
I love my M3 AWD LR with aero and for the first year the range (wh/mi) was great. It’s a May 2019 built car, and 35,000 miles. Now I am ready to scream.

Recently we have had to do a few road trips that are 130-150 miles each way and the experience has sucked. On Thursday I charged - timed for our departure and rare - to 100 percent and we did a 168 mile drive, with under 20 percent when we reached our destination. Flat highway almost entire trip (Chicago area to Michigan) with top speed never over 80, usually more like 75 and with TACC. Tires in good shape with correct air pressure. Above freezing temp outside and cabin at 68 (plus we left with car pre-heated).

We returned today 168 mile trip, battery starting at 90 percent and warm enough to not have a cold warning, about 39F outside during drive. We had the “stay below 70 to reach your destination” almost immediately, and a lot of the trip was under 70. Average energy shows as 356 wh/mi. Getting home is the lowest I’ve ever had the battery, 2%.. it’s not even freezing outside!

On hand I am considering upgrading to FSD after trying it on a friend’s m3 but on the other hand I’m about ready to sell this thing because it sucks to not be able to go 170 miles on a long range battery. I have had it without sentry on, not plugged in, at different charge points so in theory the BMS should be calibrated.
I have recently contacted service center, gotten remote analysis, and been told there is nothing wrong with the car battery, motors, and electronics.
 
  • Informative
Reactions: Lindenwood
It's cool in Newcastle upon Tyne (not as cold as AAKEE's place :))! Do you know what, or have an estimate of, your average SoC has been since new? Looking at the graph you have an NMC M48 battery (5C) like my M3. The graph is quite similar to my M3. I have about 1.4% "apparent" degradation after 4226 Km. I say "apparent" since the NFP values read in SMT change as a function of SoC, resting/storage temperature and use. My NFP reads at about 73.6 kWh average right now.

Here is 6 months worth of SOC, as this level of zoom out it one reading per day at midnight. So effectively what the car has during the night for the past 6 months.

1649155302825.png
 
rts off at the dawn of time with 74 kWh @59 m
The data shown is nice and interesting to see. Looking at the graphs, the battery capacity starts off at the dawn of time with 74 kWh @59 miles (~94 Km) and the app states, 73.8 kWh (top right).

@MichalT and @Candleflame, do you consider that there's no degradation hidden in the graphs shown?

I have several questions. Do you know what battery you have? When did you get delivery in 2021? I thought (right or wrong?) that range is calculated based off the NFP value and a Wh/km value. Does the Tessie data, "battery capacity" represent NFP as per SMT (Nominal Full Pack)?

For the pros here - I understood that the BMS impacts max rated range so does it influence the NFP measurement via OBD from the car? Data and graphs can be misleading.

If you don't want to discuss, or don't agree then that's fine - all this is my pure curiosity, Does it matter if there's a bit of degradation? You see a lot of alarmed posts about 1 mile less here. It's normal. I really enjoy my M3 and my questions come from wanting to understand the car and how the battery works best and how it can be treated best
😎

From what I understand from Tessie, it uses pure extrapolation from %, so add 37 kWh and reposted SOC goes up by 50%, well thats a 74 kWh battery.

Big charges will be more accurate than small charges.

Not 100% what my actual battery is, but from the data I can see I have about 74kWh between 0-100%. For all I know there is a bunch available under zero thats its keeping in reserve.

1649155462976.png
 
Here is 6 months worth of SOC, as this level of zoom out it one reading per day at midnight. So effectively what the car has during the night for the past 6 months.

View attachment 790261
Thanks for that! So you had an average SoC of 40-45% Oct-Dec and ~85% Dec to March. Does this start from the "dawn of time" like the range/battery capacity?
 
From what I understand from Tessie, it uses pure extrapolation from %, so add 37 kWh and reposted SOC goes up by 50%, well thats a 74 kWh battery.

Big charges will be more accurate than small charges.

Not 100% what my actual battery is, but from the data I can see I have about 74kWh between 0-100%. For all I know there is a bunch available under zero thats its keeping in reserve.

View attachment 790262
So does your M3 date from second half of October 2021? Based on what you say, and your data, it's possible that you have a "74.5 kWh" LG M48 NMC battery (like my M3).
 
Picked it up on the 23rd of Sept 21
So, I would bet your battery is the same as my Model 3 given your timeline and what we know about deliveries to Europe from China (see graphics 1 and 2). My M3 LR AWD (registration document "EC5D") was delivered (in France) on September 30, 2021. Sorry this first URL is in French:
Batteries et autonomie à 100% des Model 3 LR / Performance - Forum et Blog Tesla

Refer to Q3 2021 in graphic 2:
https://teslamotorsclub.com/tmc/attachments/1630346415996-png.703246/

These above are the arguments I use to say your M3 appears similar to mine.

The graphic you show from "Tessie" does indeed suggest that you have experienced no "degradation" since delivery. It's my opinion that this graphical representation is misleading.

Why?

I would first refer you to the multiple posts and solid reasoning of @AAKEE on this particular master thread. He's really a sage on all this and can enlighten you on how to treat your M3 battery whether LCA or NMC. His recommendations certainly strongly influenced me on how to treat my M3 battery.

Second, there's a lot of hype about "degradation" and everybody quotes max rated range which can, erroneously in my opinion, show no "loss" of range for a long time. Here, there are several points that should be considered:
1) These data are supplied by the BMS, that magical citadel few really understand fully, including me.
2) Included from this BMS are data for max rated range, SoCs, NFP and so on (certainly if you look at these in SMT).
3) Some of these signals are very "noisy", such as max rated range (MRR), which is really much more so than NPF, particularly when you compare them graphically and calculate the Standard Deviation of the data sets (from SMT, my NFP data set is ~x10 less noisy than my MRR data set).
4) Some have criticized the calculation of degradation via NFP/(Full Pack When New). Sure, I just happen to think this is a more reliable calculation than plotting max rated range against the odo. Or at least, I would just plot MRR against elapsed time thus only using one BMS parameter in the plot, not two (lowers errors x errors!).
5) In the end, there's no easy way to calculate "degradation". Look at this nice graphic from Degradation (thank you, Amund Børsand, developer of SMT). On this graphic your M3 will likely have some degradation in your mileage timeline (~2.4% @ 6500 M, as calculated from the graph which also seems to accord with my ~1.4-1.7% degradation @4250 kM) calculated from NFP. Yes, I know that data is an aggregate battery plot!

I'll leave you to decide and form your opinion on what I've said. Rather long, sorry. However, there's a lot of uninformed opinion on this subject. There, I've stuck my neck out for chopping off
😎
One last thing, I absolutely love my M3, it's a fantastic car, don't extrapolate my comments as negative!
 
  • Like
Reactions: Bouba
So, I would bet your battery is the same as my Model 3 given your timeline and what we know about deliveries to Europe from China (see graphics 1 and 2). My M3 LR AWD (registration document "EC5D") was delivered (in France) on September 30, 2021. Sorry this first URL is in French:
Batteries et autonomie à 100% des Model 3 LR / Performance - Forum et Blog Tesla

Refer to Q3 2021 in graphic 2:
https://teslamotorsclub.com/tmc/attachments/1630346415996-png.703246/

These above are the arguments I use to say your M3 appears similar to mine.

The graphic you show from "Tessie" does indeed suggest that you have experienced no "degradation" since delivery. It's my opinion that this graphical representation is misleading.

Why?

I would first refer you to the multiple posts and solid reasoning of @AAKEE on this particular master thread. He's really a sage on all this and can enlighten you on how to treat your M3 battery whether LCA or NMC. His recommendations certainly strongly influenced me on how to treat my M3 battery.

Second, there's a lot of hype about "degradation" and everybody quotes max rated range which can, erroneously in my opinion, show no "loss" of range for a long time. Here, there are several points that should be considered:
1) These data are supplied by the BMS, that magical citadel few really understand fully, including me.
2) Included from this BMS are data for max rated range, SoCs, NFP and so on (certainly if you look at these in SMT).
3) Some of these signals are very "noisy", such as max rated range (MRR), which is really much more so than NPF, particularly when you compare them graphically and calculate the Standard Deviation of the data sets (from SMT, my NFP data set is ~x10 less noisy than my MRR data set).
4) Some have criticized the calculation of degradation via NFP/(Full Pack When New). Sure, I just happen to think this is a more reliable calculation than plotting max rated range against the odo. Or at least, I would just plot MRR against elapsed time thus only using one BMS parameter in the plot, not two (lowers errors x errors!).
5) In the end, there's no easy way to calculate "degradation". Look at this nice graphic from Degradation (thank you, Amund Børsand, developer of SMT). On this graphic your M3 will likely have some degradation in your mileage timeline (~2.4% @ 6500 M, as calculated from the graph which also seems to accord with my ~1.4-1.7% degradation @4250 kM) calculated from NFP. Yes, I know that data is an aggregate battery plot!

I'll leave you to decide and form your opinion on what I've said. Rather long, sorry. However, there's a lot of uninformed opinion on this subject. There, I've stuck my neck out for chopping off
😎
One last thing, I absolutely love my M3, it's a fantastic car, don't extrapolate my comments as negative!
I gave you a thumbs up 👍 but that was only so that people think I understood what you wrote 😜
 
Hi,

I've been testing with my M3LR 5L and it seems to always apply 80% of the max discharge power. At full charge the BMS indicates around 400 kW and the max value obtained with SMT has been 320 kW. But when the SoC and the temp are lower I still get 80% of the BMs reported value, so if 365 kW I get around 290 kW. Has anyone observed the same behaviour? Maybe Tesla limited the LR to 80% of the max discharge power to be sure that the performance is always quicker than a LR. Dont know if the acceleration boost will change that.


This is posted here, because the I dont see a similar good discussion in the Model Y section and also because the Model 3 Performance is supposed to be released with this drive train pretty soon (Q2/2022 in Europe maybe?)

I have had the chance to do some testing with Nr.15 out of "Giga Berlin". One of the thirty cars delivered and signed by EM himself.

Here are the Performance Results:
cf3892ec19296c6d1c8cd2e43fb22068dcbbdd61.png

177dafa748297541718af71284afdee3c5ad9477.jpeg


  • The Model Y 2022 in Europe is always equipped with the LG Chem 5L 79kWh Battery Pack.
  • The car was Supercharged to 100%. At the Start of the run the car was at 98% SoC / 50°C.
  • The absolute maximum discharge power observed was 416kW. A Panasonic 3L 82kWh would be in the 450kW+ area, which is quite a big difference.
  • As soon as you start driving, you see a drop in the maximum discharge power.
  • Full Power when passing 80kph you see a maximum Battery Power of 410kW, so the car is always battery power limited and starts losing power immediately when you start driving. A M3P 2021 is power limited at around 425-430kW. With a hot pack the battery power limit will be reached at around 75% SoC, not directly at 100% like in the EU MYP.
  • In daily driving at 80% or below there should be no significant power difference to a Long Range with Boost and no difference at all when passing around 120kph.
  • I did an invalid (low sat) Dragy measurement, which was at 4,8s 0-100kph (slope corrected). This should only be regarded as a side note, but I thought it's worth mentioning.
There is a lot going for the Model /3Y Performance in Europe ,but i think in regards to pure Performance this is a step back and the older or US Performance cars will turn out to be faster in general. All due to the choice of battery pack.

Here is a quick diagram to explain the two different power limits.
One from the Battery Pack and one set by Tesla for each product.
The numbers should not be regarded as absolute, but a rough direction so you get the idea an the differences:
7e2bbc48bce601d59394ba29928b17cea4996e6d.png
 
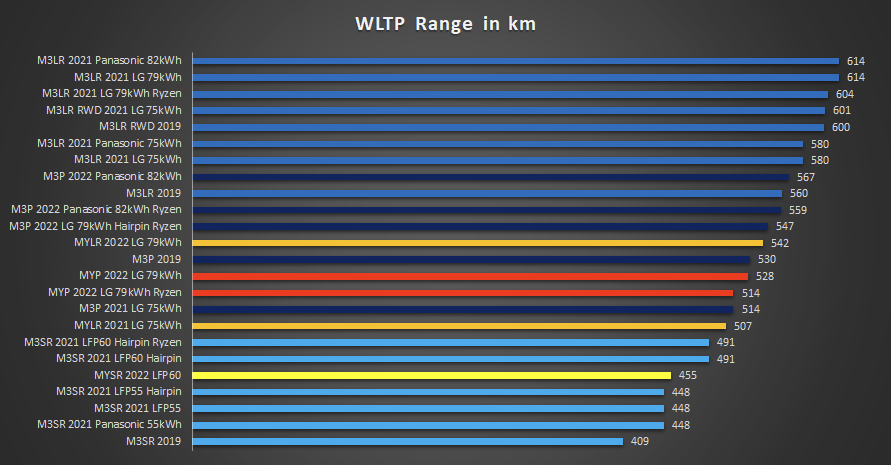
What makes the 2021 LR so much more efficient than 2019 models?
The battery capacity isn't that much different to mine, but it shows 100km extra range.
Mostly just the different (fixed) rated consumption figure that is set in the car.
  • M3LR 2018-2020 uses 152,5Wh/km
  • M3LR 2021-2022 uses 137Wh/km
Generally there are some hints in the WLTP test results seen here:

a324e96c8855f5457419ba950662ea2985f24d1f.png

f3ef0c98f0980c4d68db4d4ce172cee5aefadc06.png

1309ffda339faf28c754ccd56f7f54b6fd35a2fc.png

VarianteDrive UnitVersionConsumptionRange CombinedRange Cityf0f1f2Rolling Resist.Test MassMCU
12356Wh/kmkmkmNN/(km/h)N/(km/h)²RRkg###
E1RGb/p149409531152,20,5490,028497,431806Atom
E3RGp147600786149,780,56270,025957,431844Atom
E3DGb160560682183,040,430,0277,432047Atom
E3DGp166530635199,650,980,0258,952047Atom
E1CRGb142430548133,720,772880,025037,51780Atom
E1LRGb140448583133,70,7730,025037,51780Atom
E6CRGb142448563149,9160,62990,024827,531905Atom
E6CRQb142448573146,50,7820,023797,51905Atom
E6LRQb144491619139,50,650,026187,51915Atom
E6LR#b144491603158,90,8620,021577,51915Ryzen
E5CRGb140601749149,920,62990,024727,531905Atom
E3CDGb148580706146,6650,78710,02497,531999Atom
E3LDGb147614779146,70,7870,02497,51999Atom
E5CD#b148580715146,6650,78710,02497,531999Atom
E5LD#b147614743146,70,7870,02497,51999Atom
E5LD#b147604723146,70,7870,02497,51999Ryzen
E5LD#p165547671155,81,4470,023128,661999Ryzen
E3LD#p165567656250,51-0,52530,031148,661999Atom
E3LD#p165559644250,51-0,52530,031148,661999Ryzen
E5CDGp165514597250,506-0,52530,031148,661999Atom
Y5CDZb1695076071631,0590,026587,062211Atom
Y5LDZb1695426551631,0590,026587,062211Atom
Y5LDZp171528639169,60,9420,0287882150Atom
Y5LDZp171514607176,11,080,0255882187Ryzen
Y6LRZb157455559157,31,0270,023937,062153Atom
 
What makes the 2021 LR so much more efficient than 2019 models?
The battery capacity isn't that much different to mine, but it shows 100km extra range.
I believe it's unlikely that his car has no battery degradation. The Full Rated Range parameter can show no drop off for some time until it reaches a "degradation threshold" whilst other measurements such as NFP (Nominal Full Pack) can show that the battery is losing capacity before the "degradation threshold". That said he could live in a geographical area that is generally cooler - which would help limit calendar aging. There are plenty of Tesla M3 owners that have very nice graphics showing no or minimal degradation such as @KenC and @AAKEE whilst others such as @Candleflame have observed higher degradation because they lived in much warmer climates. I'm just quoting what I read. You can find their posts and comments in these forums. Regards range, there are other things than can influence range such as BMS calibration. There are plenty of posts on that subject from those members better qualified than me to comment on that including the above and @AlanSubie4Life. Others too so please don't be offended:cool: if I didn't mention all of you
 
  • Like
Reactions: Stan930 and Dave EV