FredMt
TM3 LR Q4 2021 (after LR Q4 2019 and M3P Q2 2021)
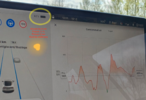
@ AlanSubie4Life, here are energy screens from 100%. It stay at 100% /506km during 3,3km.
Attachments


Last edited:


You can install our site as a web app on your iOS device by utilizing the Add to Home Screen feature in Safari. Please see this thread for more details on this.
Note: This feature may not be available in some browsers.
Yes i know, it was just to show you before. Look at time. Screen seems to be cap at 507, but you can see, it go on charging during a long time.Unfortunately, really need the energy screen (which tells you how much energy you have left). Calculating Your Battery's Estimated Capacity Using the Car's Energy Screen
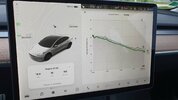
If you could take just one more, in distance mode, corresponding to the 98% picture, that would be great. Just to avoid any ambiguity, take at the same time (when stationary!), one in each display mode, not at 100%. You can (and should) be in park for these pictures. For safety, and it also improves the data since you're taking two pictures which are supposed to be at the same energy level.And from 100%
Here are 2 pictures after with distance.If you could take just one more, in distance mode, corresponding to the 98% picture, that would be great. Just to avoid any ambiguity, take at the same time (when stationary!), one in each display mode, not at 100%. You can (and should) be in park for these pictures. For safety, and it also improves the data since you're taking two pictures which are supposed to be at the same energy level.
It can be lower than 98% of course.
EDIT:
However, I think we have what we need (since your car does not charge to 508/509km - if it charged to 508/509km we'd need the above, but it doesn't):
Constant is ~159.65Wh/rkm (we'll call it 160Wh/rkm but it's probably 257Wh/mi).
And your energy at max is 80.8kWh or so. (396km *204Wh/mi = 80.8kWh. 80.8kWh/506km = 159.7Wh/rkm = 257Wh/mi)
This constant does seem different than in the past. So it seems like it has now changed twice:
1) The first time it was a constant adjustment with constant energy (so just bookkeeping). I'd have to review this thread to see the concrete evidence for this, but we have a datapoint from @AAKEE. Just not sure about energy screen captures.
2) Now they seem to have increased the available battery limit, while keeping max display km the same, which means a larger constant. The evidence for this is pretty clear (though I'd like to see the energy screen from someone with a very high capacity battery).
The new battery limit (pending details from someone over the cap) seems to be 508.5km*159.7Wh/rkm = 81.2kWh.
I'd expect that this limit can be exceeded (it's a display limit I think, not an actual limit on max capacity), and it would be very interesting to see an energy screen capture (both % and km at the exact same time) from someone who does exceed it (both fully charged and also at lower charge).
To be clear this is what I mean:Here are 2 pictures after with distance.
Sorry AlanSubie4Life, these pictures were taken almost 2 months ago. I understood and I will do as you said next timeMust be stationary...otherwise the two numbers are harder to line up (though the delta in the trip meter does help back calculate the error I suppose...but it can take a while to update so stationary is better).
 thank you again!
Sorry AlanSubie4Life, these pictures were taken almost 2 months ago. I understood and I will do as you said next time
I might do another trip to the closest SuC to fo another full charge.If possible, if you could also take an energy screen picture as described above, that would be helpful. Here is the sample to avoid any confusion: Calculating Your Battery's Estimated Capacity Using the Car's Energy Screen
I'm not sure; you could answer the question though. (As discussed previously (in this thread I think), the actual kWh value it uses for the calculation is a scaled (by the SOC) version of something like Nominal Full Pack (which exact Nominal value is used (there are two in SMT) I am not sure). In other words, because of this scaling, the amount of the buffer included in the kWh value used for the calculation is scaled by the SoC. None of the buffer is included at 0%, 90% is included at 90%.)I see the use of the energy app to get the constant, but I would guess the energy app use the nominal remaining as the base for that calculation?
and most of the photos from the Supercharging session is gone.
Yep, sounds like exactly what would be expected. Not optimal since he was sitting there in Park for a bit, but at least he had the climate control completely off while doing his talking (very important!), so the test is probably pretty good.Found this interesting Performance Video from Switzerland with 90km/h.
Beeing Switzerland it wasn't very flat, so there surely was some regen in the calculation, but nevertheless he managed to pull 75kWh, with about 2% or 1.6kWh to spare and 3.6kWh below 0%.
Makes total 80+kWh and if we factor in 500Wh heat loss then the 81-81.5kWh are realistic.
")
I took some pictures this morning after charging to 80% during last night. Note that i don t have SMT, sorry. We have also to keep in mind that for the last 2 months, my car has been in my garage most of the time because of teleworking, and SoC has been kept on average around 60%.Makes another set of pictures (at your convenience) showing things are still exactly the same even more helpful. Doesn't require a 100% Supercharge to get some information.
I'm the actual kWh value it uses for the calculation is a scaled (by the SOC) version of something like Nominal Full Pack (which exact Nominal value is used (there are two in SMT) I am not sure)
and 3.6kWh below zero
It seems you are perfect 78%I took some pictures this morning after charging to 80% during last night. Note that i don t have SMT, sorry. We have also to keep in mind that for the last 2 months, my car has been in my garage most of the time because of teleworking, and SoC has been kept on average around 60%.
(Edit : I drive with überturbine wheels at the moment).
Just drive your car and stop worrying about 0.5kWh. It will be gone soon so or so. You can expect around 10% degradation over the lifetime of the car.
It does seem likely we had the constant about right (around 159Wh/rkm, and in fact slightly lower as pointed out above...80.6kWh/316mi = 255Wh/mi = 158.5Wh/km). I use 316mi because of @AAKEE ’s observations above about 508/509km...I took some pictures this morning after charging to 80% during last night. Note that i don t have SMT, sorry. We have also to keep in mind that for the last 2 months, my car has been in my garage most of the time because of teleworking, and SoC has been kept on average around 60%.
(Edit : I drive with überturbine wheels at the moment).