


Welcome to Tesla Motors Club
Discuss Tesla's Model S, Model 3, Model X, Model Y, Cybertruck, Roadster and More.
Register
Install the app
How to install the app on iOS
You can install our site as a web app on your iOS device by utilizing the Add to Home Screen feature in Safari. Please see this thread for more details on this.
Note: This feature may not be available in some browsers.
-
Want to remove ads? Register an account and login to see fewer ads, and become a Supporting Member to remove almost all ads.
You are using an out of date browser. It may not display this or other websites correctly.
You should upgrade or use an alternative browser.
You should upgrade or use an alternative browser.
Range Loss Over Time, What Can Be Expected, Efficiency, How to Maintain Battery Health
- Thread starter KK_RedM3
- Start date
Empty tank
MXLR/BLK/Cream/20"/FSD Delivered 6/15/22 Flawless
382? Can you provide documents for this statement?but why is it only showing 311 miles at 100% when it is rated at 382 ?
382? Can you provide documents for this statement?
This is a 2021 performance. 315 miles EPA range, 352 WLTP.but why is it only showing 311 miles at 100% when it is rated at 382 ?
AlanSubie4Life
Efficiency Obsessed Member
Should I be concerned with 5% loss in just over a month?
Yeah that is kind of a lot. But you started a bit low (some batteries are just not as energetic), and it is maybe getting a bit chillier which can sometimes impact the estimate. (Not last winter but maybe they changed the algorithm.)
We’ve also seen bad estimates recover, so there is a small chance you will see a recovery.
But for now you’re at 77kWh or so. I don’t think there is a problem though. It’s entirely possible you’ll be slightly below the average curve for the life of your vehicle though.
What was the max range indication for a 2019 LR? I remember someone wrote that it was increased with an update from 499/500km /310mi to a little higher value?
It never increased from 499/500km for the 2019. (This can be confirmed by looking at the energy screen in distance display mode at high SOC, to calculate the constant on any 2019 Model 3 AWD vehicle and then divide 77.8kWh, the known new capacity, by that value.)
The increase to 322 miles occurred in the 2020 model year. (Same energy and probably the same efficiency vehicle though, since 2019 vehicles got that enabling efficiency update as well - without the displayed range change.)
Last edited:
Thank You, I was hoping for you to answer.Yeah that is kind of a lot. But you started a bit low (some batteries are just not as energetic), and it is maybe getting a bit chillier which can sometimes impact fhe estimate. (Not last winter but maybe they changed the algorithm.)
We’ve also seen bad estimates recover, so there is a small chance you will see a recovery.
But for now you’re at 77kWh or so. I don’t think there is a problem though. It’s entirely possible you’ll be slightly below the average curve for the life of your vehicle though.
It never increased from 499/500km for the 2019. (This can be confirmed by looking at the energy screen in distance display mode at high SOC, to calculate the constant on any 2019 vehicle and then divide 77.8kWh, the known new capacity, by that value.)
")
( I didnt have a LR to check so… )
Me too, quite significant. I've driven 285 miles to Tebay non stop before. But that's seemingly not possible any more. I was hoping that it might be temporary or it might be because she wasn't driven over the summer. Almost always gently charged via solar and rarely supercharged..I've come to the conclusion that it must be software related as it happened before the recent temperature drops.. the first dip was at 21c.
Attachments
Wow, 285miles... so, you started at 100%, and ran it down to about 10%? Why? Aren't there a half dozen superchargers on your route? Looking at ABRP, it says it would take you 4h50m and driving slower than the speed limit to make it, when a 5min charge at Gretna Green, on the route, would result in a faster overall trip, 4h23m, since you don't have to go slow to make it. If you drive 115% of the speed limit, you can even make it in 3h53m with a 9min charge, that's almost a whole hour faster.Me too, quite significant. I've driven 285 miles to Tebay non stop before. But that's seemingly not possible any more. I was hoping that it might be temporary or it might be because she wasn't driven over the summer. Almost always gently charged via solar and rarely supercharged..I've come to the conclusion that it must be software related as it happened before the recent temperature drops.. the first dip was at 21c.
With deg, or without deg, it doesn't really change the trip math all that much, as long as there are plenty of superchargers.
Paige111
Member
So 240mls real rangewhat Im getting is average for M3LR21 w/353 EPA range ? Tesla should post this alongside the trims on their ordering site- I would have chosen the M3P if I known they actually get more real range -274 mls . Alot of people buy the LR for the 353 ml range it boasts, 240ml real range is a total let downSo the preliminary document from the EPA for 2021 Model 3 AWD & Performance is released:
https://iaspub.epa.gov/otaqpub/display_file.jsp?docid=51235&flag=1
Covers 18" AWD and 20" Performance in detail. Note: it describes the details of the heat pump similar to the Model Y.
Summary (AWD):
1) No increase in battery capacity for AWD (yet)
2) For 18" AWD, increase in city miles & highway miles due to a 6% City efficiency improvement, and 3% Hwy efficiency improvement. Note this is not directly related to the heat pump since these are the standard UDDS and HWFET cycles, which would not have climate control on.
3) 2% reduction in RLHP at 50 mph, presumably due to the new Michelin MXM4 tire version.
4) LESS energy extracted from battery during test than normal (78.6kWh vs. 79.5kWh prior years). This hurts the range, but due to the efficiency improvements this 1.2% reduction, doesn't make much difference to range (still increases).
Summary (Performance):
1) The battery capacity of the Performance seems to have increased by about 3%. 80.8kWh extracted!!!! Not clear if this is "one-off" or deliberate. I think intentional, but not certain.
2) For Performance AWD 20", virtually zero improvement in efficiency.
3) Something weird happened on the recharge of the Performance (lots of wasted energy, ~3kWh AC). I think this will be addressed in later updated filings.
4) Pretty similar RLHP; only a fraction of a % lower.
5) I think it will probably end up with a rated range of about 315 miles. (Estimated) 16 mile improvement, half from battery capacity improvement, half from heat pump.
Summary, Both
1) Motor power specs have been changed and look weird, but not sure we should read much into that except MAYBE the AWD and P have the same rear motor now.
2) Details on heat pump outlined. No PTC heater at all; uses the compressor as a heater in very cold conditions.
3) There is a change to the battery energy density specs vs. 2020, but this is not of great significance, since the prior energy density numbers didn't work out correctly anyway, it is hard to compare. I think now 165Wh/kg is just correct (and it was close to this before!) Gives a capacity of 79.2kWh if you just multiply it out (480kg battery).
So, going from above, here is what I think has happened:
Summary of Changes for 2021:
1) It looks like AWD incorporated the motor efficiency improvements that existed on 2020 Model 3 Performance (remember it was more efficient than the AWD according to EPA testing, and got 10 more rated miles than the AWD, but was voluntarily reduced)
2) AWD also got improvements in tire efficiency.
3) Taking these factors together, for the same battery capacity as prior years, AWD (non-P) would have about 335 rated miles range, vs. prior year 322 (4% improvement).
4) The additional 18 miles range improvement, taking it to projected 353-mile range on the website, is from the scalar increase (due to the heat pump). The scalar looks like it will be about 0.746.
So the pareto, AWD, adding 31 rated miles, to go from 322 to 353:
1) 18 miles improvement due to scalar changes (heat pump); will not be "realizable" if not using climate control.
2) 13 miles improvement due to efficiency improvements (apparently taking on the Performance 2020 rear motor?)
Hypothetical Performance Pareto, adding 16 rated miles:
1) 8 rated miles added due to capacity increases. (Assuming they stick.)
2) 8 rated miles added due to heat pump (not realizable if not using climate control)
So, based on the Performance battery, it looks to me that there MAY be about 3% more (or more!) battery capacity that could be unlocked in future for AWD - but it depends on which batteries are being installed on these vehicles. We don't know. If that were done, and the 3% increase to 80.8kWh was made available for the AWD rather than 78.6kWh:
The Model 3 AWD 18" would have a range of about: 353*80.8/78.6 = 363 rated miles
(Note, this is the range the Performance 2021 WILL have already, assuming that the 80.8kWh "sticks", and you run it with 18" MXM4s - but with 20" wheels it's going to be rated around 315, probably, unless they voluntarily reduce the range)
I'm attaching my worksheet here, but please not this is preliminary and I can't vouch for all the numbers (I've filled in some guesses for the scalar to make things line up, for now). The fields in orange are not guesses, except for the scalar.
View attachment 602900
The Tesla FI report it's about your blue 2020 LR with 16k miles?Me too, quite significant. I've driven 285 miles to Tebay non stop before. But that's seemingly not possible any more. I was hoping that it might be temporary or it might be because she wasn't driven over the summer. Almost always gently charged via solar and rarely supercharged..I've come to the conclusion that it must be software related as it happened before the recent temperature drops.. the first dip was at 21c.
I was driving myself and wanted to try to get into the TeslaFi top ranges list.. back then it started about 268 miles. Thats the only reason. It was very tight on the uphill sections down to 3% over the southern uplands but then I gained 3% on the descent to Tebay... only one problem though..the app/logon for some reason disconnected before I left.. with the result that the journey wasn't recorded.. I was gutted. I haven't had the opportunity or the temperatures to do it again.Wow, 285miles... so, you started at 100%, and ran it down to about 10%? Why? Aren't there a half dozen superchargers on your route? Looking at ABRP, it says it would take you 4h50m and driving slower than the speed limit to make it, when a 5min charge at Gretna Green, on the route, would result in a faster overall trip, 4h23m, since you don't have to go slow to make it. If you drive 115% of the speed limit, you can even make it in 3h53m with a 9min charge, that's almost a whole hour faster.
With deg, or without deg, it doesn't really change the trip math all that much, as long as there are plenty of superchargers.
YesThe Tesla FI report it's about your blue 2020 LR with 16k miles?
A technical question..... is the range (on the small battery icon) based on driving history or (more likely) based on a notional watts per km (148 watts per km)? And the driving history is found on the Energy Graphs.
Because, here’s my problem. The range estimate is reasonably accurate (not counting invisible usage like Sentry Mode etc). A twenty kilometers trip around town takes 20 km off the range. But the energy graph shows that I’ve only used, say 110 watts per km (and gives an estimated range way higher than the main gauge).
So, why the discrepancy ?
it's because the Energy Graphs are based on total battery capacity , so INCLUDING 4,5% buffer.A technical question..... is the range (on the small battery icon) based on driving history or (more likely) based on a notional watts per km (148 watts per km)? And the driving history is found on the Energy Graphs.
Because, here’s my problem. The range estimate is reasonably accurate (not counting invisible usage like Sentry Mode etc). A twenty kilometers trip around town takes 20 km off the range. But the energy graph shows that I’ve only used, say 110 watts per km (and gives an estimated range way higher than the main gauge).
So, why the discrepancy ?
To have the proof, start a trip and see the Energy Graphs after exactly 10km (or 25 or 50km) and you will see that the average in Energy Graphs is always about 5% better comapred than the trip on the rectanguar window in the left bottom of the screen
Thank you for the replyit's because the Energy Graphs are based on total battery capacity , so INCLUDING 4,5% buffer.
To have the proof, start a trip and see the Energy Graphs after exactly 10km (or 25 or 50km) and you will see that the average in Energy Graphs is always about 5% better comapred than the trip on the rectanguar window in the left bottom of the screen
 So if the energy graph includes the buffer, does that mean that the range estimates (on the battery icon) does not?
Correct, the range on the battery icon is without buffer.Thank you for the reply
And when at 0% (or 0 km left) you sill have about ~3,5 kWh.
The range (km or miles) on icon battery is a CAPACITY unit measure, not in kWh but in km only because is calculated on a constant (Wh/km) thatt Tesla put in the equation.
This number in km in the icon battery has nothing to do w driving history or driving style.
If you have (for example ) 500 km on a 100% SOC, this means that if you go like a crazy F1 pilot and you burn 50% of the battery only in 100 km, you STILL see 250 left km for the remaining 50%. If it was related to driving style or history , you would see 100 left only.
SalseroYQue
New Member
My 2018 LONG RANGE RWD is showing 275 miles at 100pct, is that normal after 3 years of use or i am loosing too much range?
Candleflame
Active Member
Normal unfortunately. Slightly worse than average. Depends on kms, average storage soc and temp too.
whrussell21
New Member
Good morning,
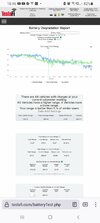
I have had my Model 3 Performance for around 3-4 months with no issues until recently. It may not be an issue because Tesla said the battery is at 100%. When I charge it to full (only been 1 time) it now says I have a stated range of 300 miles and sometimes drops to 294 from the previous 315 miles. I never charge it past 85-87% and it has never been below 20% until yesterday. It has only been supercharged 2 times in 11k miles.
I have read that it could BMS calibration but I just tried to drive it down to less than 10% and charge it back up and its stating my new 100% miles is now 294. It did say in the app when I first plugged it in that it would be 311 miles then it dropped to 308, 300, back to 308 and now 294.
Only 11k miles and it's always plugged in as recommend when not driving unless I am at work and its about 8-10 hours.
Any suggestions?
UncertainTimes
Active Member
Similar threads
- Replies
- 43
- Views
- 3K
- Replies
- 10
- Views
- 452
- Replies
- 13
- Views
- 434
- Replies
- 12
- Views
- 2K