Welcome to Tesla Motors Club
Discuss Tesla's Model S, Model 3, Model X, Model Y, Cybertruck, Roadster and More.
Register

Range Loss Over Time, What Can Be Expected, Efficiency, How to Maintain Battery Health

This site may earn commission on affiliate links.
My 2018 AWD 3LR is down to 266 miles on 100% charge. Yes, I "reset" the battery gauge on the BMS by running the car down to around 6% charge and then charging to full. The car has about 75,000 miles on it now. I seem to recall the original rated range for this car was 310 miles, being down around 14% after less than 4 years seems like pretty bad degradation? Anyone else out there with a 2018 "Tent Era" AWD 3LR can corroborate this degradation level?
 
  • Informative
Reactions: KenC
My 2018 AWD 3LR is down to 266 miles on 100% charge. Yes, I "reset" the battery gauge on the BMS by running the car down to around 6% charge and then charging to full. The car has about 75,000 miles on it now. I seem to recall the original rated range for this car was 310 miles, being down around 14% after less than 4 years seems like pretty bad degradation? Anyone else out there with a 2018 "Tent Era" AWD 3LR can corroborate this degradation level?
Below average but it happens. Also could be a couple % better than that in reality, it is an estimate and can have a little error but is likely largely correct. 266 is actually 16.2% loss (due to 76kWh/77.8kWh discrepancy).

If you live in a very hot place it might be real.
 
  • Informative
Reactions: UnknownSoldier
Here is some good information from the TMC battery expert... posted in another thread.

wk057 said:
Leaving the car sit at high (>93%) or low (<10%) SoC for extended periods is usually pretty bad. I'm not sure lose-4 miles of range in < 1 day bad, but a couple miles wouldn't be impossible in such a situation, depending on temps. Leaving at a higher SoC is worse than at a lower one for sure. My guess is in your case the BMS took some time while at the lower SoC to calibrate its per-brick capacity and IR estimates at that level (it does some fun stuff to do this using the bleeders and other data), and the end result was a slightly lower than originally estimated capacity. So, probably not fully the result of degradation from letting it sit. If you don't charge to 100% or drop to 0% under 10% every so often (at least a couple times per year), the BMS's estimate can drift a bit.

Founder, 057 Technology, LLC - @wk057 on Twitter for my latest projects and info
057tech.com for OEM Tesla Model S/X parts, Tesla Vehicle Sales, EV Conversion Components, and more
warranty.057tech.com for Tesla Model S Battery Extended Service Plans
 
Here is some good information from the TMC battery expert... posted in another thread.
Interesting, since in part, one comment contradicts what I have read here about low SoC storage - "or low (<10%) SoC for extended periods is usually pretty bad". In what way is it bad? for the battery degradation (SoH) or BMS calibration? Others on the forum are saying that low SoC storage is not damaging to the battery.
 
Last edited:
Interesting since in part one comment contradicts what I have read here about low SoC storage - "or low (<10%) SoC for extended periods is usually pretty bad". In what way is it bad? for the battery degradation (SoH) or BMS calibration? Others on the forum are saying that low SoC storage is not damaging to the battery.
One reason is that there isn’t enough power to charge the 12v battery
 
  • Disagree
Reactions: Dave EV
One reason is that there isn’t enough power to charge the 12v battery
Indeed it would be interesting to see the forum users thoughts on this. I have seen a video blog showing how quickly the 12V battery goes down in a MY with -4.5% SoC ie at the bottom end of the energy buffer. However, I had thought that above the screen "0" display (+4.5% SoC, energy buffer), there was always enough juice to keep the 12V charged.
 
An Update on the ROLLER COASTER of my 03/2021 M3P with E3LD 82.1 pack. (31K km today)
I wanted to see where it ended to rise. It stops to raise up to 79,6 (just like when new), and I had no time to perform a 100% charge because when I decided to, it started to plummet at 1 kWh "chunks" every day or two.
then last week I charged to 100% and it went to around 77.00 kWh (from 76,5)
now it's 4 or 5 days that it stays at 77.
1656505832736.png

what I want always to say is that there is NO way to know which is the REAL NFP, expecially in a E3LD 82,1 battery.
EDIT: or better: there is NO way to know which is the State of Health (or real degradation) of the battery. NFP is useless
 
Last edited:
  • Informative
Reactions: KenC
An Update on the ROLLER COASTER of my 03/2021 M3P with E3LD 82.1 pack. (31K km today)
I wanted to see where it ended to rise. It stops to raise up to 79,6 (just like when new), and I had no time to perform a 100% charge because when I decided to, it started to plummet at 1 kWh "chunks" every day or two.
then last week I charged to 100% and it went to around 77.00 kWh (from 76,5)
now it's 4 or 5 days that it stays at 77.
View attachment 822583
what I want always to say is that there is NO way to know which is the REAL NFP, expecially in a E3LD 82,1 battery.
EDIT: or better: there is NO way to know which is the State of Health (or real degradation) of the battery. NFP is useless
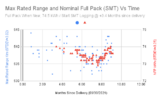
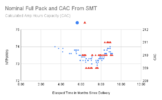
At one point in time I would have disagreed with you. More recently, my NFP also jumped around, quite out of character with its previous tendency, which was showing a clear slope down (decreasing SoH). At the start of June, prior to a 700 Km road trip, after an AC L2 charge to 100% and then the same day a supercharge, the NFP went crazy (refer attached graphs). the changes aren't remotely as great as yours shown in the graph above. So, I'm left with a difficult decision of how to interpret the changes - tendency or just plain noise? BMS irrationality - firmware, my Breton roadtrip - who knows! The founder of SMT, (Amund Børsand) suggested I look at the CAC, but that's also a calculation so I can't get my head round that either. I appreciate that @AAKEE told me to ignore minor changes but really, even if the overall change is no more than 1% NFP in my case it's quite weird :mad: Alternative interpretations most welcome!
 

Attachments

  • Max Rated Range and Nominal Full Pack (SMT) Vs Time (1).png
    Max Rated Range and Nominal Full Pack (SMT) Vs Time (1).png
    30.5 KB · Views: 47
  • Nominal Full Pack and CAC From SMT.png
    Nominal Full Pack and CAC From SMT.png
    21.4 KB · Views: 48
  • Like
Reactions: conv90 and AAKEE
At one point in time I would have disagreed with you. More recently, my NFP also jumped around, quite out of character with its previous tendency, which was showing a clear slope down (decreasing SoH). At the start of June, prior to a 700 Km road trip, after an AC L2 charge to 100% and then the same day a supercharge, the NFP went crazy (refer attached graphs). the changes aren't remotely as great as yours shown in the graph above. So, I'm left with a difficult decision of how to interpret the changes - tendency or just plain noise? BMS irrationality - firmware, my Breton roadtrip - who knows! The founder of SMT, (Amund Børsand) suggested I look at the CAC, but that's also a calculation so I can't get my head round that either. I appreciate that @AAKEE told me to ignore minor changes but really, even if the overall change is no more than 1% NFP in my case it's quite weird :mad: Alternative interpretations most welcome!
The BMS probably does a good job over all if we try see the big picture.

People here is probably more interrested in any little deviation and some pf us teads too much into changes in the NFP (specially decreasing NFP)

It seems like there is no coincidence that some changes in NFP comes after software updates of the cars. With Teslalogger and the software update dates it becomes quite obvious, and this also

I had a NFP at around 80.5-81 kWh not very long ago. I did one discharge down to around -2% to try to reset the BMS as I was sure my NFP was overestimated and my own capacity estimation said around 79kWh.
The “reset” worked and the NFP decreased to 79.2 kWh. Shortly After this I did drive down to 0% and than supercharged to 100%, still 79.2 indicated. I would guess that the real capacity is not very far from 79.
After an update a few weeks ago, the NFP dropped steady step by step to 77.0 kWh.
(During this time the car did much bigger cycles than normally due to some trips, and almost no small cycles at all.

I am sure that the real capacity not will decrease 4 kWh / 5% during a short period so I am positive that this is BMS software related and maybe the changed usage have affected the NFP.

My guess is that the NFP will go up to around 79kWh, and I think the real capacity is somewhere around this.
My average SOC is around 40% and the average cell temp since september is 12C so the battery will not degrade fast.

Not at home (where my teslalogger data is available) so I can not post a picture of the very clear connection between the software and the change in NFP /range.

My collegue with a 80K km ‘19 LR reported that the range was suddenly “restored” to new car values from around 7-8% degradation which seemed to have happend at the same time as my drop.
I would not think that the NFP is on track on this car either.

Conclusion: the range/NFP values should not be taken as true as the can be all over the place.
Thanks for your comments as ever. Can I ask if the CAC is of any use?
 
  • Like
Reactions: conv90
Thanks for your comments as ever. Can I ask if the CAC is of any use?
To me it looks nearly perfectly correlated with NFP from your plots (if I understand correctly), except with large rounding error. Which is what you would expect since generally (roughly speaking) it should be related by the effective “average” voltage of the pack during the discharge, to the NFP. (Wh = Ah * V). Obviously there is an integral involved here…
 
  • Like
Reactions: conv90 and Steve446
To me it looks nearly perfectly correlated with NFP from your plots (if I understand correctly), except with large rounding error. Which is what you would expect since generally (roughly speaking) it should be related by the effective “average” voltage of the pack during the discharge, to the NFP. (Wh = Ah * V). Obviously there is an integral involved here…
Thank you!
 
  • Like
Reactions: conv90
To me it looks nearly perfectly correlated with NFP from your plots (if I understand correctly), except with large rounding error. Which is what you would expect since generally (roughly speaking) it should be related by the effective “average” voltage of the pack during the discharge, to the NFP. (Wh = Ah * V). Obviously there is an integral involved here…
CAC should be the calculated capacity and it should correlate perfectly to the NFP.
( I do not know if Tesla have any calculations to change the “Nominal voltage”)

In short we probably should consider CAC and NFP showing the same thing, the capacity of the battery.
For making threads easy to read we perhaps should mainly only use one of these values. I have not looked at the CAC, ever, really as I refer to the NFP.
A brief look in my car show that the calculation CAC x Nomimal voltage is close to the NFP(delta 0.4 kWh)

Energy stored is per definition
[Nominal Voltage x capacity].

If we play with that the Nominal voltage is 3.6V for these cells, the nominal voltage for the pack is 96 x 3.6 = 345.6V

A CAC of 230Ah would give:
345.6 x 230 = 79.488 Wh.
They’re obviously free to scale CAC however they want to make the estimated capacity match CAC*Vnom.

But assuming constant current draw over a time period until the battery is empty, and CAC is that constant current * time, then the associated V to give the exact correct capacity would be the time-averaged value of the discharge voltage, which is not necessarily the same as Vnom.

As I said, entirely possible they just rescale CAC so that it is just whatever the estimated capacity is divided by Vnom.

It seems to me they probably do what you say if the capacity divided by Vnom always matches the CAC.

If Ah capacity for batteries is always measured energy content (measured at a given current draw since it depends on current draw due to internal losses) divided by Vnom (presumably chosen at a given point in the discharge curve) then it’s all consistent.

Just depends on definitions I guess. But in the end the CAC should not provide additional info which is the point here I guess.
 
They’re obviously free to scale CAC however they want to make the estimated capacity match CAC*Vnom.

But assuming constant current draw over a time period until the battery is empty, and CAC is that constant current * time, then the associated V to give the exact correct capacity would be the time-averaged value of the discharge voltage, which is not necessarily the same as Vnom.

But if you look at virtually *any* battery cell and calculate the nominal voltage x Amphere hours you find the rated energy in Wh.
And if you look at battery nerd sites, battery tests mostly hit that number in discharge tests.
The nominal voltage number is the same as the average voltage during discharge, or if you like measured energy / measured Amphere hours. Thats the real meaning of the nominal voltage, its not hjust a random number ;)

One quick example( just took the first google hit, but you should find hundreds of examples.
Panasonic spec, and nerd trst of the same
(NCR18650BD)
0A44E3A2-3DCB-44DE-A646-CAEF01E65F20.jpeg

86943B58-4216-45CC-8774-998A49072E3B.jpeg

He noted that it actually delivered better than the spec at 0.2C
Panasonic NCR18650BD 3200mAh 10A cell's capacity test
 
The nominal voltage number is the same as the average voltage during discharge, or if you like measured energy / measured Amphere hours. Thats the real meaning of the nominal voltage, its not hjust a random number
No, it is not a random number! It can be defined in a variety of ways though. I don’t know what the typical approved “standard” definition is, but it doesn’t really matter.

My only point was that depending on how it is defined, Vnom may or may not match the time averaged voltage. If it does, great.

Anyway either way it wouldn’t change whether CAC provides additional info (it doesn’t). Any difference in definition of Vnom would result in a scaling of CAC.

nominal voltage x Amphere hours you find the rated energy in Wh.
Sure. But for example in your plot if you back calculate Energy divided by mAh you end up with a huge range of voltages from 3.6 to 3.2V. (Of course - you can see it in the plots, high C rates lead to less energy (integral of I*V) and lower voltage.) Anyway it just all has to be specified at a particular C-rate and definitions need to be consistent.

Anyway, not trying to make any grand pronouncements or be at all precise about this here - there is too much to discuss here that would take us off topic - in the end I think we both agree CAC doesn’t provide additional info.
 
  • Like
Reactions: Steve446 and AAKEE
My only point was that depending on how it is defined, Vnom may or may not match the time averaged voltage. If it does, great.

Anyway either way it wouldn’t change whether CAC provides additional info (it doesn’t). Any difference in definition of Vnom would result in a scaling of CAC.
The other way around. The CAC is the calculated capacity in Ah and the NFP is the calculated energy capacity.

If the nominal voltage would be changed in the BMS calculation, this would not affect the CAC but it would affect the energy capacity.
A badly worned battery would have increased internal resistance due to increased SEI and lithium plating etc.
This would incease the voltage droop for the same load, and in my mind probably lower the actual average voltage during a discharge cycle. It is possible that Tesla keep this in track and adjust the “nominal voltage” number to adjust the NFP (as a lower voltage will decrease the energy content for the same CAC).

The (only) Caveat in the formula [nominal voltage x Amphere hours = energy content] is the possibility that Tesla adjust the nominal voltage in the calculation and thereby offset the exact relationship as we see it today.
If this is the case, the NFP is the (only) interresting value as we need energy, not Ah to drive from A to B.

The conclusion should be that (in general) to look at the NFP and not use CAC.
 
The other way around. The CAC is the calculated capacity in Ah and the NFP is the calculated energy capacity.
Right, nothing I said contradicts that.
If the nominal voltage would be changed in the BMS calculation, this would not affect the CAC but it would affect the energy capacity.
Right. But since the energy capacity doesn’t change, of course, since it can’t (unless a different discharge rate is used where there is a ton of internal loss), if they changed Vnom (for whatever reason) then CAC would have to change (scale) to make sure energy capacity doesn’t. That’s all I was saying.

Anyway based on all the SMT captures obviously the voltage used is about 3.6V per cell, as you say, which does not contradict anything I have said. (This is the time-averaged value of the discharge voltage for the discharge rate at which they define CAC. I think.)
 
Last edited:
  • Like
Reactions: AAKEE
Good morning! I am a new Tesla Model 3 RWD owner. I bought it used, its a 2021, and only has 12,000 miles. I drove it the first time to my town grocery store and back home, only maybe 20 miles total, but percent went from 80% down to 58%?! I have driven it to work all this week and switched from % display to miles, and the miles is always off in comparison to actual miles driven and miles lost per battery. For instance, i actually drove 75 miles round trip, but car battery shows a loss of 112 miles. Only driving 75 miles and battery % went down 47% (89% down to 42%). Oh, and the battery will lose 5% just sitting there from work arrival at 8 am to 4:45 pm. Is this normal or should i have dealership do something about this before its too late?