Welcome to Tesla Motors Club
Discuss Tesla's Model S, Model 3, Model X, Model Y, Cybertruck, Roadster and More.
Register

Max Power vs State of Charge and Temp

This site may earn commission on affiliate links.
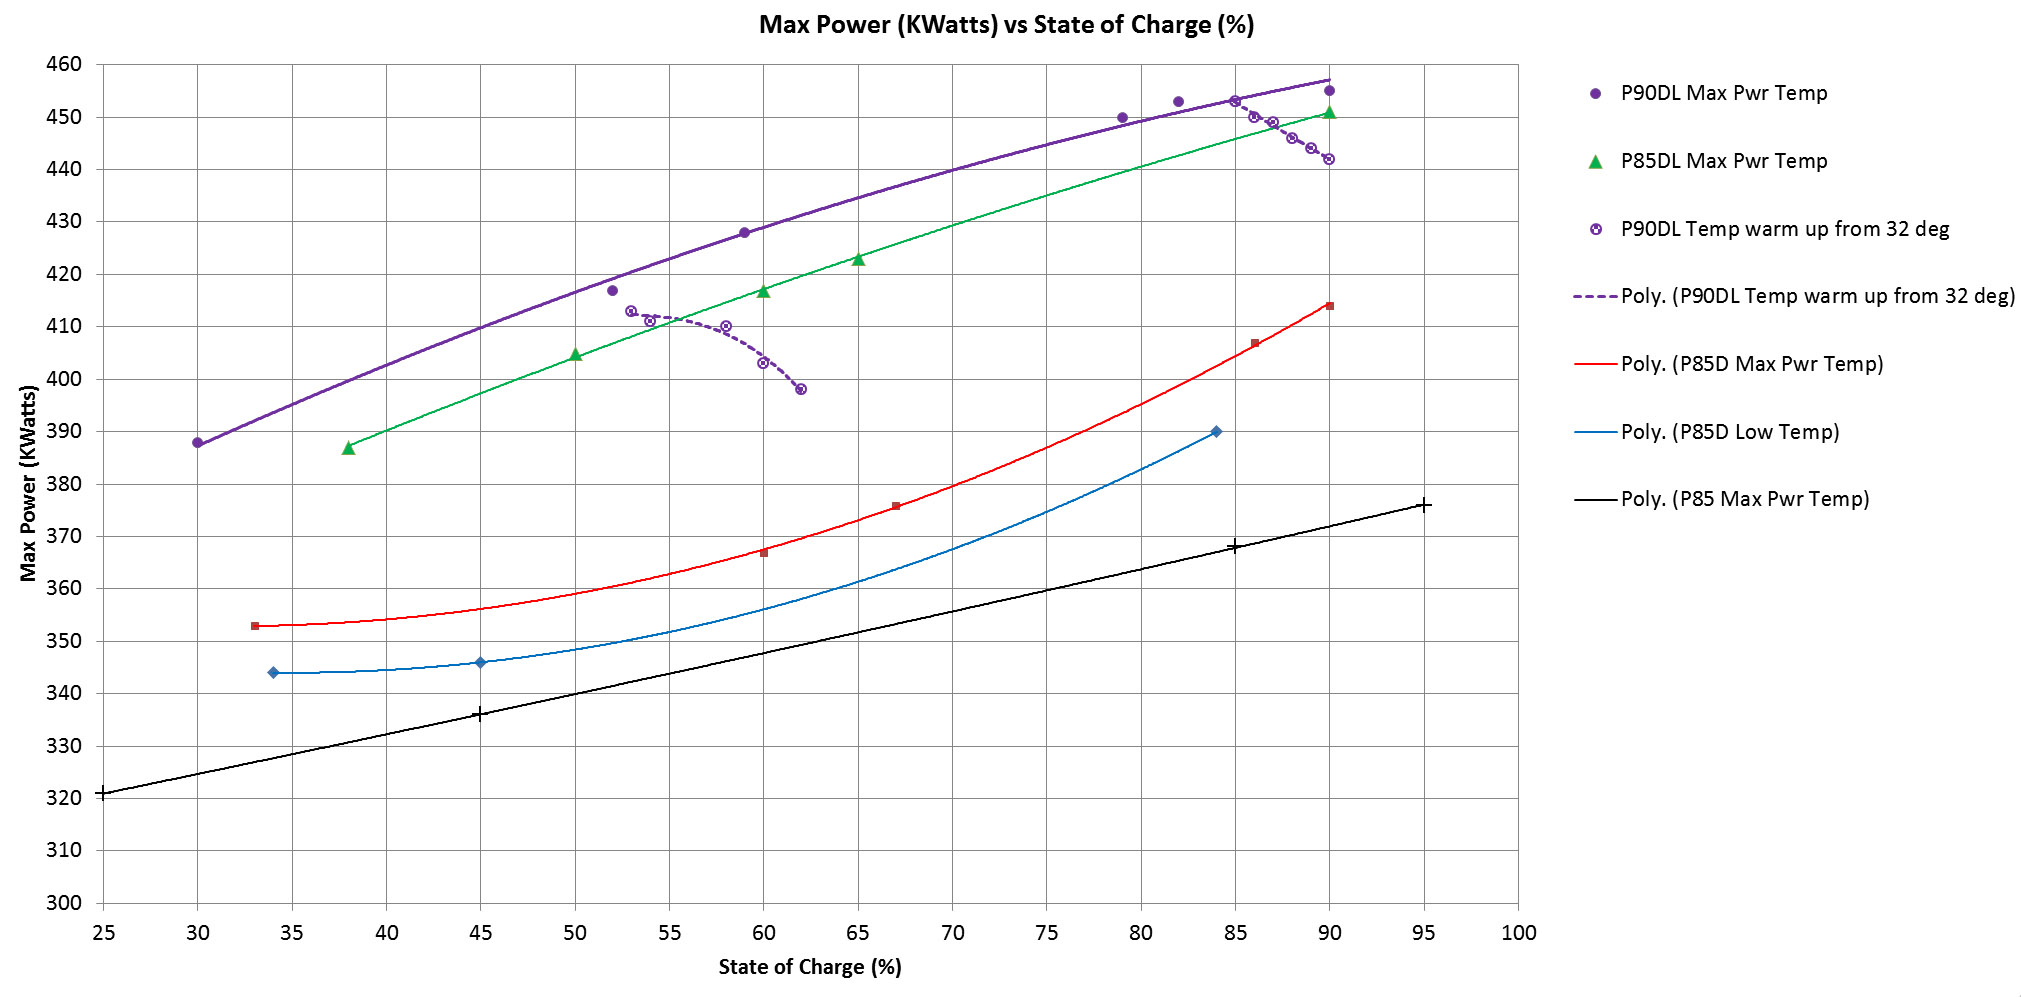
I've been collecting data from various threads in an attempt to understand how battery Max Power varies with battery State of Charge (SOC) and temperature. Here are the results so far:

TeslaPwr16a.jpg


Since receiving my P90DL, I've been able to add some of my own data including a test of how the max power is effected by temperature as the battery warms up during usage. The dashed purple line shows data collected from a "cold" battery in 32 degrees temperature. It appears that it takes about 15% of battery driving drain before it gets close to max power.

If anyone would like to contribute to the data, the IOS PowerTools app will allow you to measure the max power during a hard acceleration. Probably the easiest way to collect this is to briefly floor it while traveling at 30 mph. You can changed the power measurement from HP to KW in the settings area.
 
Last edited:
  • Informative
Reactions: David99 and GSP
I have a P85. Here are the maximums I've observed since October 2013:

Below 20% SOC, the maximum I've seen on my car is 300 kW, on the nose.
At 25-35% SOC, the maximum I've seen on my car is 321 kW.
At 45-55% SOC, the maximum I've seen on my car is 336 kW.
At 85-90% SOC, the maximum I've seen on my car is 368 kW.
At 95-100% SOC, the maximum I've seen on my car is 376 kW.

(also found here: What's your 90%? - Page 44 )

Unfortunately, it'll take a lot more work (and time that I don't really have this time of year) to dig up the temperatures associated with these, but I hope this helps.
 
  • Informative
Reactions: sorka and GSP
I have a P85. Here are the maximums I've observed since October 2013:

Below 20% SOC, the maximum I've seen on my car is 300 kW, on the nose.
At 25-35% SOC, the maximum I've seen on my car is 321 kW.
At 45-55% SOC, the maximum I've seen on my car is 336 kW.
At 85-90% SOC, the maximum I've seen on my car is 368 kW.
At 95-100% SOC, the maximum I've seen on my car is 376 kW.

Wow, those are very low numbers. Are you sure they are not average power measurements? What we are trying to plot is the Peak Max Power which is shown in the IOS PowerTools app during a floored acceleration. Or maybe your results are correct and it is just there is less power for a single motor P85. Come to think of it, that does make sense. I'll wait for your confirmation and then add your data as a separate curve for the P85.

Thanks

These are direct results from the API, likely the same thing you get with the powertools app. This is indeed a single-motor P85 (signature car).
 
FlasherZs numbers are absolutely in line with a P85.

Keep in mind that you need pack temp, not ambient temp.

Unfortunately as I understand it, it is not possible to show pack temp. It would be great to have real time temp of the battery. I suppose any attempt to slip in a wireless temp sensor would violate warranty. Anyway, here's an updated chart with the inclusion of FlasherZ's P85 data:

TeslaPwr17.jpg
 
  • Helpful
Reactions: GSP
Why is low temp going backwards? Decreasing temp? Perhaps add temp as point labels, or just make a new graph.

I debated about including the power curve from a totally cold battery as it warmed up. The curve looks backwards because we normally see peak power reduce as the SOC reduces. However with a cold battery the increase in peak power as the battery warms is much greater than the power loss from a lower SOC. I thought it was interesting to see how the curve converges toward the normal peak power line after approximately 15% battery drain brings the temperature up closer to the max pwr temp.

The other low temperature for a P85D curve looks more normal because each data point was taken at about the same temp (California garage temp).
 
Last edited:
Interesting. My P85DL hit 453KW at 90% after supercharging but without max battery set.
I'll have to update the chart to reflect that. It is interesting that the updated P85D to ludicrous is so close, if not equal, to the P90D at the 90% point. There is more of a difference in the mid range SOC but even that is close. I can't imagine anyone with a P85D not taking advantage of such an excellent upgrade. Besides the added enjoyment from the extra power, it is bound to increase the future resell value of the car by a fair amount.
 
That's a great collection of data. There is nothing 'backwards' about the temperature effect--it is well known that a colder pack has less capacity available than a warmer one, so at any given SOC a cold pack will have a lower output power as measured. It is interesting to see how the lines converge as the pack warms up.

Maybe if it were plotted from 100% SoC on the left and 0% on the right it would seem more intuitive and less 'backward' to some...