Welcome to Tesla Motors Club
Discuss Tesla's Model S, Model 3, Model X, Model Y, Cybertruck, Roadster and More.
Register

Model X Supercharging curves, 2022

This site may earn commission on affiliate links.
'Charge curve' graphs usually display charge rate , given in kilowatts, vs state-of-charge, given as a percentage of maximum charge, also known as SoC.

(You *could * plot this as charge rate vs elapsed time which really illustrates why you don't want to supercharge to 100% unless you have a lot of time to kill. Anyway most people graph it the other way.)

A typical charge session ramps up the kW to a max value where it plateaus for awhile and then, as the battery fills up, the rate "tapers" downward steadily from that peak.

Have a look at actual observed data from 2019 to get a feel for this.

One way of thinking about the 'taper' is monitoring the sum of SoC + kW.

For a large part of a typical supercharging session this sum is nearly constant. During this main phase of supercharging, it's pretty much a one-for-one tradeoff , a 1% increase in SoC leads to a 1kW decrease in charge rate.

Example: if your're charging at 150kW at 30 % charge, the sum for that moment is simply 180. A moment later you might see 149 kW and 31% charge. The sum is still 180.

I've seen Model 3's exceed 230. Not sure what the latest plaid X's can do.

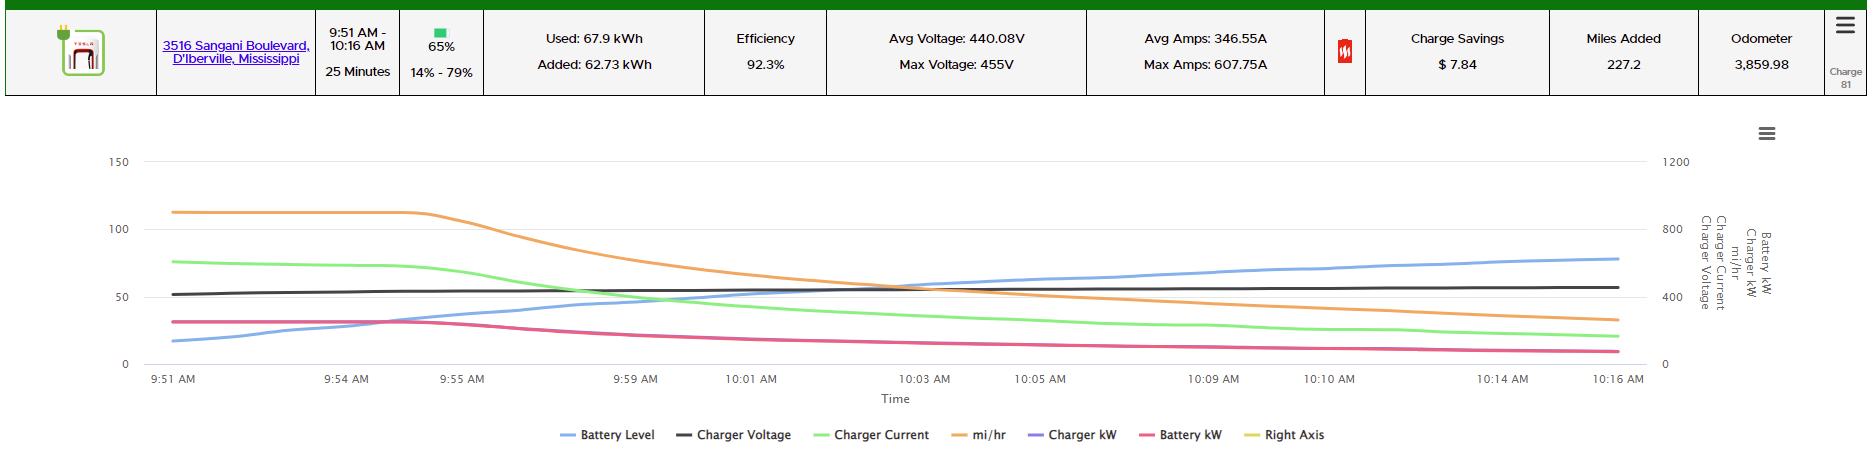
Today my 2016 P90D was able to maintain SoC + kW > 140 from 30% to 65% SoC

My peak charge rate was 112kW.

Conditions were not unusual.

I got the exact same behavior a year ago in March.

(Tesla occasionally tweaks supercharging speeds with firmware updates.)

It's important to keep in mind supercharging rates are highly dependent on arrival SoC and temperature (internal pack temperature mostly, and to a lesser extent, ambient temperature as well) so a single charge session may not tell you everything.

But in general, over time you should be able to get a good feel for what your battery will take by just adding SoC+kW
 
Here's a 15-90% charge from last week.

Screen Shot 2022-05-13 at 12.37.58.png
 
Looks like the lines cross around 70 or so?

So kw+SoC is 140 for you too?

Looks like it's more common than I thought to plot charge rate relative to elapsed time: What app is that? I saw it used a lot in this other thread


Honestly that thread covers this topic pretty thoroughly even though it is supposedly specific to Raven X's in Europe.

Basicaly I was sitting at a supercharger passing the time so i thought I'd just dash off some vaguely informative orientation stuff for newbies. Sharing is caring.

Yeah, sounds about right. I can double check later. That's just a screenshot out of TeslaFi, which I gladly pay yearly for. BTW, I have a 2016 (so not Raven).
 
  • Like
Reactions: Harvey Danger
I wish TeslaFi made it easier to compare charging curves since they have all the data.
There's a feature request, but only 7 votes.... if you have Telsafi, go up vote it so we can get some traction! :)

 
There's a feature request, but only 7 votes.... if you have Telsafi, go up vote it so we can get some traction! :)


Nice, I'll go upvote.
 
I think your graph is missing the charger output (or I'm blind).

The "Charger kW" (lavender) and the "Battery kW" (red) are nearly the same value across the entire graph, so the lavender trace is hidden behind the red trace.

Here's the raw data:

DateCharging StateBattery LevelBattery RangeCharge Energy AddedCharge RateCharger VoltagePower
9:50:01 AMCharging
14​
48.39​
0​
537.6​
386​
-149​
9:51:00 AMCharging
17​
58​
2.76​
901.4​
413​
-250​
9:52:00 AMCharging
20​
71.3​
6.45​
900.3​
420​
-249​
9:52:59 AMCharging
25​
85.71​
10.34​
899.8​
425​
-249​
9:54:00 AMCharging
28​
99.01​
14.12​
900​
428​
-249​
9:55:07 AMCharging
33​
115.26​
18.62​
900.7​
432​
-250​
9:55:59 AMCharging
37​
125.97​
21.39​
848.2​
433​
-235​
9:57:00 AMCharging
40​
139.64​
25.48​
756.5​
434​
-210​
9:58:00 AMCharging
44​
151.46​
28.55​
676.4​
435​
-187​
9:59:00 AMCharging
46​
161.81​
31.62​
614.7​
436​
-170​
9:59:59 AMCharging
49​
170.68​
33.97​
567.4​
437​
-157​
10:01:00 AMCharging
52​
180.65​
36.63​
528.7​
439​
-146​
10:02:00 AMCharging
54​
188.41​
38.78​
497.4​
440​
-138​
10:02:59 AMCharging
56​
195.8​
40.83​
472.1​
441​
-131​
10:03:59 AMCharging
59​
203.55​
42.88​
446.3​
442​
-124​
10:05:01 AMCharging
61​
211.31​
45.33​
427.3​
443​
-118​
10:05:59 AMCharging
63​
217.96​
46.87​
407.1​
444​
-113​
10:07:00 AMCharging
64​
223.87​
48.61​
390.2​
445​
-108​
10:08:00 AMCharging
66​
230.15​
50.55​
374.9​
446​
-104​
10:09:01 AMCharging
68​
236.8​
52.39​
358.1​
447​
-99​
10:10:00 AMCharging
70​
242.34​
53.62​
343.6​
448​
-95​
10:10:59 AMCharging
71​
248.25​
55.46​
330.3​
449​
-92​
10:12:00 AMCharging
73​
253.43​
56.69​
317.6​
451​
-88​
10:13:00 AMCharging
74​
258.6​
58.33​
301.1​
452​
-83​
10:14:00 AMCharging
76​
263.03​
59.45​
286.6​
453​
-79​
10:14:59 AMCharging
77​
268.2​
60.78​
274.6​
454​
-76​
10:16:00 AMCharging
78​
273.01​
62.22​
262​
455​
-73​

Oh gotcha, thanks! I'm jealous of that curve. I get excited when I see 100kW!
 
Yeesh. 50% in 17 minutes.

It has become actually worth it to route and plan your trips to charge at v3 superchargers and avoid the older ones that only charge at 135-150 kW. In addition to being faster, especially at the low end of the battery, the liquid cooling makes them charge more reliably in high ambient temperatures. The older chargers have handles and cables that can get too hot in the summer and reduce the charging rate even though your battery could take more. Further, the higher total power minimizes the effects of pairing with other vehicles if the station is busy.

Obviously, this applies only to Model 3/Y and refresh S/X. Older S/X cannot charge this fast anyway, so v3 superchargers offer fewer advantages for those vehicles.
 
for the last several charges at the V3 (250) chargers, I get pretty quick ramp down :(

I have a Jan 2020 delivered Model X

Wonder if there is something wrong with the cooling? I did have 3 way coolant valve replaced in July (as I saw coolant leak on my floor), but these captures are after Tesla replaced the valve, purged the system and added coolant.

Thoughts?

1662991545481.png

1662991785958.png

1662991600108.png
 
  • Informative
Reactions: Araman0
for the last several charges at the V3 (250) chargers, I get pretty quick ramp down :(

I have a Jan 2020 delivered Model X

Wonder if there is something wrong with the cooling? I did have 3 way coolant valve replaced in July (as I saw coolant leak on my floor), but these captures are after Tesla replaced the valve, purged the system and added coolant.
Looks like a cooling issue, at least my 10/2020 maintains the max rate (150kW in the EU) up to 47% when properly warm. Yours is the F pack and it does have more cooling issues than G/H due to the wiring thickness but I have seen people do better than that with much older cars.
 
I bought mine 9/2018..half as fast as yours. I’m happy to get 84kw at 69% SoC. Most of time it’s in high 60s then.
Some charging results from my 2019 Raven Model X Performance and the new LR2022 model.

This graph is Raven

1663187390559.png


This graph is new 2022 LR

1663187470238.png


Same V3 charger albeit the sessions are a year apart. The new LR can maintain over 200kW+ until approx 40% SOC and by 50% still over 150kW (154). At 60% its down to 123kW. On my Raven once I got to 37% the rate is flat around 92-94kW all the way to 71%. The new model is a game changer at v3 charging stations. At this point I have to rush my wife and kid to go take a bathroom break as the car will be ready when they get back! That's a real nice change for travel scenarios, drive ~3 hrs stop for 12-15 mins.

Hope this helps