Welcome to Tesla Motors Club
Discuss Tesla's Model S, Model 3, Model X, Model Y, Cybertruck, Roadster and More.
Register

Powerwall efficiency 86%....

This site may earn commission on affiliate links.
I realized that this is the total efficiency which includes near term AC-DC-AC losses as well as long term degradation. If we assume that the AC-DC-AC losses are on the order of 10% then I am seeing more like 5% degradation.
I guess this depends on how you want to look at efficiency. The PW just sitting there is losing energy due to battery leakage and running the internal electronics and cooling. This usually around 0.200-0.250 kWh per day per PW. These losses will not adjust in the exported energy number, but they will be in the imported number.

If you leave the PW in standby mode and use exported/imported then you will trend towards 0%. If you are discharging to 10-20% nightly then you should tend towards 87-92% efficiency.

If you are just looking at the recharge efficiency then I use (exported - days*225*num_pws)/imported.
 
  • Informative
Reactions: BGbreeder
My most recent data and efficiency has dropped, from 83.2% to 82.7%, Jun to Jul.
When looking into the data with respect to previous user comments, it appears that when the PW is not used very frequently, the "overhead losses" add up and contribute to lack of efficiency, which sounds about right. That appears to be my situation.
Average monthly PW losses are ~23.5kW (less than 1 kW/day) with little dependency of usage.
If I was smart enough to use regression analysis, maybe I could figure out to constant and the variable PW usage.
FWIW - I am using the Time Based control / Cost Savings, reserving 60% for outages. Storm Watch and Tesla Virtual PP are active.
I am going to reduce this to 40% for a month or 2 and observe effects. I suspect using more energy from the PW will increase efficiency.
If you were not in Monterey Bay I would suspect heat would have a big role in this. For those of us interior the fans run a lot when it 90*F plus. I am not sure how you can be in cost savings with a reserve of 60% but again the coast thing. During these hotter summer days I had to lower my reserve to 30% just to keep from running out of PW power during peak, which is basically death to Cost Savings mode when on EV1-A.
 
My most recent data and efficiency has dropped, from 83.2% to 82.7%, Jun to Jul.
When looking into the data with respect to previous user comments, it appears that when the PW is not used very frequently, the "overhead losses" add up and contribute to lack of efficiency, which sounds about right. That appears to be my situation.
Average monthly PW losses are ~23.5kW (less than 1 kW/day) with little dependency of usage.
If I was smart enough to use regression analysis, maybe I could figure out to constant and the variable PW usage.
FWIW - I am using the Time Based control / Cost Savings, reserving 60% for outages. Storm Watch and Tesla Virtual PP are active.
I am going to reduce this to 40% for a month or 2 and observe effects. I suspect using more energy from the PW will increase efficiency.
Losing 1kWh per day would be 4-5x the expectation for a single Powerwall of 0.20-0.25kWh. How many Powerwalls do you have?
 
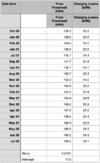
I took a crack at performing a simple regression analysis of the 19 months of data. It's been several decades since performing this level of math, so feel free to provide constructive comments or point out possible errors.
A simple regression with the following equation y=0.08X+11.6, indicates the fixed PW overhead consumption of ~11.6kWH/month or 385 Wh/day, and operating efficiency losses of ~8%. Chart of data is below.
PW Loss Chart.jpg
 
  • Helpful
Reactions: BGbreeder
I took a crack at performing a simple regression analysis of the 19 months of data. It's been several decades since performing this level of math, so feel free to provide constructive comments or point out possible errors.
A simple regression with the following equation y=0.08X+11.6, indicates the fixed PW overhead consumption of ~11.6kWH/month or 385 Wh/day, and operating efficiency losses of ~8%. Chart of data is below.View attachment 694984
Raw data used for this analysis
1628636427492.png
 

Attachments

  • 1628636385742.png
    1628636385742.png
    99.1 KB · Views: 38
  • Informative
Reactions: BGbreeder
Attached is the data from the past 3 months in pdf format.
I am unsure of how you came up with the monthly numbers, I was too lazy to try an reverse engineer them, so here is my analysis of your 3 months.

First, I calculated the "To PowerWall" number using (Solar+From_Powerwall+From_Grid) - (Home_Usage + To_Grid).
Second, I calculated the "Raw Efficiency %" using "To_Powerwall[date-1])"/"From_Powerwall[date]". You need to offset the date here as the Powerwall is charged in the morning and then discharged in the evening, so the discharge is refilled the next day. Note: Raw means without considered Powerwall leakage and self-consumption.

The average daily raw efficiency I compute as 87% and the median daily raw efficiency as 88%. There were two days with over 150% that indicate some issues with the data, on the low side there was a 0% and 41% day.

Over the 91 full cycles the Powerwalls exported 445.6 kWh and imported 514.1 kWh for a cumulative raw efficiency of 86.7%. Assuming that your single Powerwall has daily leakage and self consumption that requires 0.22kWh of import that is the consensus here, that changes your net import to 494.1 kWh and an effective efficiency of 90.2%. Which is inline with the Tesla spec of 90% efficiency.

Your data appears to be normal and it is definitely not losing 1 kWh per day.

Date timeHome Usage (kWh)Solar Energy (kWh)From Powerwall (kWh)From Grid (kWh)To Grid (kWh)To Powerwall (kWh)Raw Eff %
2021-05-0155.929.15.94214.46.7
2021-05-0257.329.56.740.812.17.677.6%
2021-05-0316.829.34.26.4176.1109.8%
2021-05-0415.328.64.93.616.15.773.7%
2021-05-0514.229.44.53.718.4598.0%
2021-05-0647.429.25.829.611.55.778.9%
2021-05-0747.730.45.733.315.36.490.6%
2021-05-0815.830.44.34.217.25.996.6%
2021-05-0938.829.24.927.616.56.467.2%
2021-05-1014.129.85.42.618.35.490.7%
2021-05-113130.16.814.514.4690.0%
2021-05-1255.6305.244.316.67.393.2%
2021-05-1361.830.4551.619.55.791.2%
2021-05-1443.931.35.732.319.65.886.2%
2021-05-1520.98.5314.31.23.7154.1%
2021-05-1655.514.25.644.92.86.446.9%
2021-05-1766.726.23.957.114.5693.3%
2021-05-1822.1316.65.715.45.867.2%
2021-05-1917.331.23.84.916.46.2106.5%
2021-05-2015.431.76.43.520.65.667.9%
2021-05-2147.227.84.534.513.46.2103.2%
2021-05-229.431.932.322.55.384.9%
2021-05-239.330.24.6121.35.257.7%
2021-05-2411.330.85.91.321.45.386.8%
2021-05-2545.730.34.13720.25.5107.3%
2021-05-2614.731.76.32.620.45.574.5%
2021-05-2717.831.43.16.517.16.1103.3%
2021-05-2871.331.68.657.518.97.541.3%
2021-05-2923.729.35.511.416.56143.3%
2021-05-3064.6275.548.510.4691.7%
2021-05-3120.630.356.7156.485.9%
2021-06-0172.830.8656.614.16.576.9%
2021-06-021830.85.16.2186.198.4%
2021-06-0316.130.83.84.617.25.986.4%
2021-06-0446.830.74.636.920.74.780.9%
2021-06-0519.8316.35.216.56.274.2%
2021-06-0646.929.24.734.215.35.9106.8%
2021-06-0714.731.633.517.65.881.0%
2021-06-0811.421.55.81.912.75.158.8%
2021-06-0913.525.34.93.614.85.5105.5%
2021-06-1022.531.83.99.617.25.687.5%
2021-06-1152.130.73.942.620.54.684.8%
2021-06-1215.730.16.3419.55.275.0%
2021-06-1387.430.86.47113.77.188.7%
2021-06-1478.427.66.162.210.37.288.9%
2021-06-1516.831.53.27.619.75.8105.2%
2021-06-1611.728.44.82.619.1564.0%
2021-06-1712.628.84.53.318.85.292.3%
2021-06-1812.929.74.63.319.45.384.9%
2021-06-191330.24.43.319.75.288.5%
2021-06-202831.2512.315.15.481.5%
2021-06-2147.927.36.133.212.7683.3%
2021-06-2241.910.55.733.81.76.495.3%
2021-06-2313.6283.63.715.85.996.6%
2021-06-2434.325.54.323.614.44.776.6%
2021-06-2521.731.265.7165.282.7%
2021-06-263430.15.321.7176.198.4%
2021-06-2723.529.85.38.313.9688.3%
2021-06-2846.5305.332.315.25.989.8%
2021-06-2918.529.94.37.917.6688.3%
2021-06-3025.730.73.514.517.15.972.9%
2021-07-0112.129.44.23.3204.872.9%
2021-07-0212.131.34.72.921.65.280.8%
2021-07-0316.127.44.54.814.95.782.5%
2021-07-0410.531.54.32.222.25.384.9%
2021-07-0586.731.57.472.218.36.170.5%
2021-07-0664.930.74.955.320.25.8127.6%
2021-07-0731.731.25.221.620.45.983.1%
2021-07-0838.329.45.32919.4686.7%
2021-07-093628.65.125.817.5688.3%
2021-07-1042.828.65.328.413.65.986.4%
2021-07-1137.129.35.327.719.2688.3%
2021-07-1220.629.65.310.919.35.989.8%
2021-07-1344.831.45.334.520.4688.3%
2021-07-1426.231.25.314.919.16.186.9%
2021-07-1551.631.35.341.120.1688.3%
2021-07-1649.731.75.237.218.4688.3%
2021-07-1723.431.10.614.5166.876.5%
2021-07-1867.429.3056.217.70.4150.0%
2021-07-1923.728.95.39.920.10.30.0%
2021-07-2019.628.64.910.418.3688.3%
2021-07-2114.830.25.15.3205.884.5%
2021-07-2241.330.65.332.321.35.691.1%
2021-07-2336.730.75.228.121.3688.3%
2021-07-2420.530.2310.416.96.283.9%
2021-07-2516.129.53.38.121.43.488.2%
2021-07-2613.822.94.76.516.63.789.2%
2021-07-2750.228.84.940.718.75.585.5%
2021-07-2834.726.84.82617.35.687.5%
2021-07-2915.121.94.97.513.65.685.7%
2021-07-3056.824.63.946.812.95.687.5%
2021-07-3123.528.62.213.615.15.867.2%
Total445.6Total514.186.7%
 
Thanks for your comments and analysis, insightful.
Monthly data, just a summation of the daily data obtained by downloading from the Tesla App.

It appears that both efficiency analysis’s are pretty close.

Using a rough form of regression analysis, the daily o/h is ~385wH, where you and others are reporting 220Wh/day. The difference between these numbers changes overall efficiency by 0.1% if daily Powerwall usage is 165kWh

Regression analysis indicates 92% efficiency (excluding daily o/h) vs. the 3 month snapshot of ~90%, reasonable difference.

As mentioned earlier, I have lowered the discharge limit to 40% from 60%, expected overall efficiency to improve, but will monitor to validate.
 
  • Informative
Reactions: BGbreeder
I've noticed a significant increase in my Powerwall self consumption since the 21.44 firmware update on 12/16. I was seeing 200-250W per PW per day assuming a 90% charge efficiency, but since then it has increased to 400-450W per PW per day. I do not believe that this is due to colder winter temp as it wasn't like this last year. Any one else seeing this? I submitted a support request in the app which I don't expect to get any response from.

1645661631584.png

The red bar is for 12/16 when the firmware update happened for me. The lower period was during summer months and I am thinking that it was due to much higher charge kW being more efficient.
 
How are you calculating the self-consumption data?
I am using this formula (90% * IMPORT) - EXPORT. My Powerwalls are setup to only discharge during Peak, so the EXPORT is from the day before and the IMPORT is from today and I record the data from the REST API before the Peak period starts each day. I have eliminated data points in the chart when the Powerwalls did not get to 100% which is why there are some blank spots.
 
I've noticed a significant increase in my Powerwall self consumption since the 21.44 firmware update on 12/16. I was seeing 200-250W per PW per day assuming a 90% charge efficiency, but since then it has increased to 400-450W per PW per day. I do not believe that this is due to colder winter temp as it wasn't like this last year. Any one else seeing this? I submitted a support request in the app which I don't expect to get any response from.

View attachment 773084
The red bar is for 12/16 when the firmware update happened for me. The lower period was during summer months and I am thinking that it was due to much higher charge kW being more efficient.
Yes I noticed this too. I think the powerwall used to run some its electronics off the grid and now it is using battery power. Unfortunately I don’t have fine grain data captured before the update.
 
Yes I noticed this too. I think the powerwall used to run some its electronics off the grid and now it is using battery power. Unfortunately I don’t have fine grain data captured before the update.

Hmm, the Powerwall doesn't have an auxiliary power supply and there is only one connection to the house grid. I would expect that any import would be reported, regardless if it came from solar or the grid. I don't recall seeing any import spikes during the night pre-21.44 firmware.
 
I'm getting efficiency of only around 80%.

I have 2 Powerwalls. No solar. They discharge during peak and charge at night. Two batteries are more than enough to meet home energy needs during peak.

I'm calculating it by looking at the monthly data on the Tesla iOS app. I can see how much I drew from the grid and how much Powerwalls discharged in a given month. The difference is the loss, so for example, if loss is 20kWh and PW discharge is 100kWh, efficiency = 100 / (100+20) = 83.3%.

Am I calculating the efficiency correctly? If so, why is it so low? (you can ignore January b/c that's when I got them installed, so Powerwalls had to be charged first)

1651417073166.png