Welcome to Tesla Motors Club
Discuss Tesla's Model S, Model 3, Model X, Model Y, Cybertruck, Roadster and More.
Register

Prediction: Coal has fallen. Nuclear is next then Oil.

This site may earn commission on affiliate links.
With its sunny climate and environmentally-focused policies, California has long been a leader for solar in the United States. But in March of 2018, the state broke a solar record when the California Independent System Operator — which manages the flow of electricity for 80 percent of the state — saw an all-time record for peak demand of electricity met by solar energy: 49.95 percent on March 4, up from the previous peak of 47.2 percent set on May 14, 2017.

Interesting math. 85% of California electricity today comes from Natural Gas, Nuclear, Hydroelectric.

There is no way for my utility to know what my solar production is. None. I imagine that is true for all non-generation projects that aren't selling all their output to the major providers.

The only thing you can trust when it comes to the environment, is that certain people will alter the numbers for personal profit. Everything else is unreliable. I live in a state where they believe hydrogen motor fuel comes from solar electricity instead of steam cracking natural gas.
Try reading the paragraph slowly.
Then, if you're still confused, read the second link. It explains things clearly.
 
  • Like
Reactions: Ulmo
With its sunny climate and environmentally-focused policies, California has long been a leader for solar in the United States. But in March of 2018, the state broke a solar record when the California Independent System Operator — which manages the flow of electricity for 80 percent of the state — saw an all-time record for peak demand of electricity met by solar energy: 49.95 percent on March 4, up from the previous peak of 47.2 percent set on May 14, 2017.
Thanks. It's been over 50% during peak sun every weekend I've looked (the last two) since then:

Ulmo Allen on Twitter

Ulmo Allen on Twitter

Today, too:
Screen Shot 2018-04-22 at 11.41.19 AM.png Screen Shot 2018-04-22 at 11.42.12 AM.png

That doesn't count production and use on our side of the meter, just their (CAISO (utility)) side. On my side of the meter, March & April have been good:

PowerWall Home PowerFlow

Jason Hughes's solar system has been grid-free for many years, now, and shows no changes; he's successfully using solar for his home electricity and his electric cars:

wk057.solar

So far, we grow plants in the sun (besides specialized niches like drugs), but someday, we might be able to store sun energy for later transmission to our plants in places that are not merely taking land in far away places. We could put farms underground instead of thousands of miles away. We could grow any climate thing we have greenhouses for. If we did that, we would be truly providing all our civilian energy uses via sun that we control in addition to the ambient heat. This is not really a huge shift, since we would still have farmers; some farmers would farm sun into electricity, and some farmers would farm electricity into plants, and yet others would do it the old fasioned way (sun into plants). But, transmission could be a lot cheaper and less polluting through wires instead of trucks, and that flexibility can help. Farmers could be 100% automated, and we'd never need cheap labor to pick our fields again.
 
Last edited:
  • Love
Reactions: Brando
Interesting math. 85% of California electricity today comes from Natural Gas, Nuclear, Hydroelectric.

Simply dead wrong...

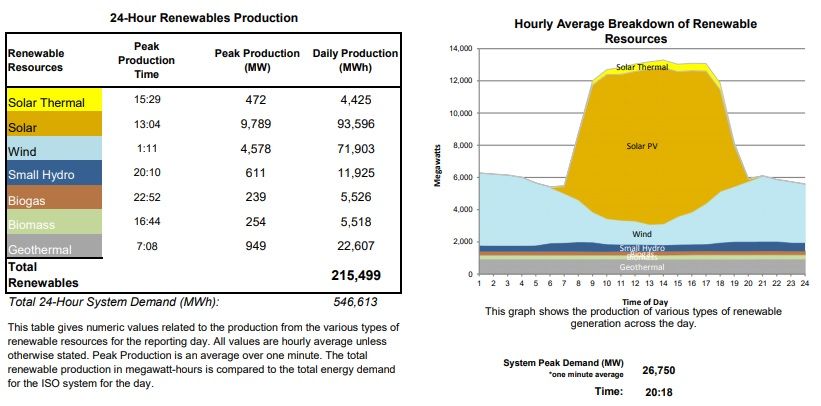
On Friday April 20th, 39.4% of California electricity production came from renewable power. But don't let the facts get in the way of making whatever point you were trying to make ;)

RT

P.S. Over all of March 2018 it was 27.0%

caliso_zps1c5tpka7.jpg
 
  • Like
Reactions: nwdiver
Pathetic Trump is getting desperate to prop up the failing coal and nuclear industries.
White House reportedly exploring wartime rule to help coal, nuclear

This is a bit of a stretch but the idiot will probably try it anyway.
The only way to counteract the need for that are:
  1. Stopping Russia's turning oil profits into funding for and action of wars of pure evil in Iran, Syria, Palestine, and North Korea, as well as locally in the first world with all the Russia-hired Marxist-Muslims invading every land.
  2. Stopping Russia's influence over our main stream Television and Newspaper media outlets to spout their lying propaganda, which hurts our ability to fight Russia and all its proxies (#1 above), and keeps our attention away from cleaning up energy (#3 below).
  3. Replacing all our energy use with solar and wind.
#1 is very hard without the oil and coal, but any thinking human can do #2, and any thinking human with money can do #3. Therefore, I strongly encourage a lot of #3 and #2 by anybody who can do it, in that order.

Luckily, we're very close to winning the wars in Syria and Iran & stopping the North Korea threat, but there is a lot yet to do and still nothing is 100% certain. That's why this is so important. While the damned East Coast Coal Dirties are doing that, and we need to win those wars so we should understand exactly what is necessary, we should be as busy cleaning up energy, not by attacking our allies, but by installing clean energy en masse. That is: install solar, batteries, and to some degree as appropriate, wind.

Also, let's not take our eyes off the ball of installing appropriate river-run energy production that doesn't hurt the environment, so that the damned anti-dam activists don't tear down our cleanest energy yet. When we're ready, we can take down the dams, but we are not ready now. We have a lot to do first. Every dam torn down now means more coal, oil, and gas pollution, and more Russia wars of absolute evil all over the world.
 
Last edited:
Glendale is shelving plans for a replacement natural gas power plant, they are requesting bids for renewable power with storage instead:

Updated: California muni shelves gas plant to consider renewable options

It's very possible that there will never be another natural gas power plant built in the state.

RT

On a recent episode of 'The Energy Gang' podcast they discussed how all infrastructure upgrades in one NE state (don't recall which one) would need to be reviewed by a special board to determine if 'wireless' solutions could be more cost-effective.

There's a sick incentive for utilities to spend more money to increase their rate base. If XYZ utility is permitted by law to collect a 'reasonable return' of ~10% on all investments which are they going to choose? The $50M demand response program or the $500M 740kV transmission line? The utility commission is usually not equipped to investigate alternatives and if the crooks at the utility provide a reasonable case for needing more transmission capacity the commission is compelled to approve it.
 
  • Informative
Reactions: Brando
Simply dead wrong...

On Friday April 20th, 39.4% of California electricity production came from renewable power. But don't let the facts get in the way of making whatever point you were trying to make ;)

RT

P.S. Over all of March 2018 it was 27.0%

caliso_zps1c5tpka7.jpg


My numbers come from the EPA. You did not reference where your numbers come from. If it's the Union of Concerned Scientists, be aware it is not a science organization anymore. It's a political and legal referral site. It's run by a lawyer who has nothing to do with science and spends most his time begging. 19% goes directly to paychecks, not including peaks or per diems or personal staff and personal transportation. Best estimate, it's 75% overhead.

Again. How do you know what small solar installations produce? You don't.
 
Glendale is shelving plans for a replacement natural gas power plant, they are requesting bids for renewable power with storage instead:

Updated: California muni shelves gas plant to consider renewable options

It's very possible that there will never be another natural gas power plant built in the state.

RT
Interesting graphic on the right side of this page:
Electric Power Monthly - U.S. Energy Information Administration
'Generating Unit Retirements" shows three large and two small NG generating units planned for retirement in the next year.
 
  • Informative
Reactions: RubberToe
My numbers come from the EPA. You did not reference where your numbers come from. If it's the Union of Concerned Scientists, be aware it is not a science organization anymore. It's a political and legal referral site. It's run by a lawyer who has nothing to do with science and spends most his time begging. 19% goes directly to paychecks, not including peaks or per diems or personal staff and personal transportation. Best estimate, it's 75% overhead.

Again. How do you know what small solar installations produce? You don't.
EIA - Electricity Data

This has more detail:
EIA - Electricity Data
 

Excellent source!

I find it interesting that CA had 11% less power produced by Nat Gas in this year than last year, AND 12% less utility scale power produced than last year. I'm taking that report to mean that utility scale solar + energy storage AND residential and commercial solar power + storage are directly replacing the power produced by utility scale Nat Gas (and utility power itself). In other words, not only did nat gas' share of the pie shrink, but the pie itself shrank. If the kwh power production drops linearly, CA will be fossil free in 5 years! Exciting times we live in!
 
  • Informative
  • Love
Reactions: Brando and mspohr
Show me where to sign !

Hell, I would jump at the chance to see a rapid transition to < 10% of 1990 levels in 15 years.

Okay, here's an interesting detail. Nationally (on page 21 of mspohr's EIA link), "small scale solar" almost tripled in 4 years from 4,947 GWh produced to 13,922 GWh.

And onto the breakout of CA's details:
page # :: statistic :: Jan YTD 2018 (GWh) :: Jan YTD 2017 (GWh) :: % change
- 22 :: CA Net Total Utility generation :: 14,381 :: 17,445 :: -17.6%
- 24 :: CA Net generation by Coal :: 27 :: 27 :: +1.2% -- all generated by industry
- 26 :: CA Net generation by Petroleum Liquids :: 3 :: 4 :: -25.4% -- mix of utility + industrial
- 28 :: CA Net generation by Petroleum Coke :: 0 :: 0 :: 0
- 30 :: CA Net generation by Nat Gas :: 7,043 :: 7,807 :: -9.8%
- 32 :: CA Net generation by Other Gases :: 121 :: 77 :: 55.9%
- 34 :: CA Net generation by Nuclear :: 1,666 :: 1,645 :: +1.3%
- 36 :: CA Net generation by Conventional Hydroelectric :: 1,590 :: 3,863 :: -58.8%
- 38 :: CA Net generation by non-Hydro Renewables :: 3,916 :: 3,761 :: +4.1%
- 40 :: CA Net generation by pumped-Hydro (storage) :: -50 :: 193 :: -125.7%
- 42 :: CA Net generation by other sources :: 65 :: 68 :: -4.0%
- 44 :: CA Net generation by Wind :: 1,139 :: 1,284 :: -11.3%
- 46 :: CA Net generation by BioMass :: 510 :: 492 :: +3.6%
- 48 :: CA Net generation by GeoThermal :: 982 :: 1,025 :: -4.2%
- 50 :: CA Net generation by Solar Photovoltaic :: 1,892 :: 1,431 :: 32.2%
- 52 :: CA Net generation by Solar Thermal :: 93 :: 65 :: +43.5% -- mainly Ivanpah


Note that the above shows Nat Gas electricity production is actually down 9.8% and not 11%. It's because i F****d up and mixed the consumption reduction with the production one. Will update my previous post accordingly. Edit: can't edit anymore, so please note the discrepancy. :(

Here's the breakout for the reduction of consumption to produce the electricity above:

- 74 :: CA Consumption of Coal for electricity :: 5,000 tons :: 5,000 tons :: -1.8%
- 76 :: CA Consumption of Petroleum Liquids for electricity :: 6,000 barrels :: 8,000 barrels :: -26.0%
- 78 :: CA Consumption of Petroleum Coke for electricity :: 0 :: 0 :: 0
- 80 :: CA Consumption of Nat Gas for electricity :: 48,778 million ft3 :: 54,913 million ft3:: -11.0%
- 82 :: CA Consumption of Landfill Gas :: 4,056 million ft3 :: 4,035 million ft3 :: +0.5%
- 84 :: CA Consumption of Biogenic Municipal Waste :: 36,000 tons :: 38,000 tons :: -4.7%
- 86 :: CA Consumption of Wood / Wood-Waste Biomass :: 3,809 billion btu's :: 3,584 billion btu's :: +6.3%
 
Thanks! You put in a lot of work into this post so pardon my being an ungrateful wretch for saying a table would have been so much easier to follow.

I'm surprised to see hydro is down. I thought water had returned to California.

Water had returned, but our reservoirs were severely depleted and needed replenishing. Also I think it's related to the pumped hydro being negative (using excess electricity to store extra water) and the reduction in utility produced electricity in general.

As for the table, go make your own you lazy bum! :)