Turns out I misremembered the details of the post so I only have the two summary screens from the night, but the first is just about halfway through the trip. Started from 100 percent/206 indicated miles and ended at 58 percent/120 indicated miles after a map-verified 65.2 miles of travel, following a close but not perfectly identical out-and-back route. Consumption is higher since I intentionally made this a more freeway-heavy test to figure out whether I'll safely be able to make the cross-country trip I'm planning for December. Seems like giving the battery a chance to start from higher up helped, but not by much.
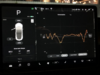
End of first half score at the very beginning of the second half, after parking for about 20 minutes:
View attachment 591413
End of second half, no intermediate stops:
View attachment 591417
Quick math at the end gives me:
- (17 kWh consumed) / (100 percent battery - 58 percent battery) = ~40.5 kWh actual capacity
- (65.2 miles of range) / (100 percent battery - 58 percent battery) = ~155 miles freeway range
- Check of (40.5 kWh est)/(155 mi est) = ~261 Wh/mi est, pretty close to what's displayed
I'm texting with a Tesla virtual tech today about this, so we'll see what their data says.
Hard to interpret this properly, because:
1) You missed critical photos: a) The picture when first starting out on your trip showing 206 rated miles with 0 miles traveled. b) The picture at the end of the first segment before exiting the vehicle.
2) You do not have your energy display set to "distance" - you have it set to "energy." Set it to distance! It's far better if you actually care about how much energy you have available (which is what we care about here). In many cases "energy" display is just fine, but not if you care about energy (ironically). Very important.
3) You do not have the trip meter set to "since x:xx". That is very important. You can't set it to "since last charge" for these calculations (though under some circumstances it can be ok). In general, it leaves too much ambiguity if we want to do these analyses.
4) We also don't know whether you spent any time sitting in the vehicle while in park (energy use in this state is
not counted by the trip meter).
5) Ideally you'd like to see closer to a full discharge for better accuracy (down to 20% would be sufficient to halve the error in the estimates).
Doing the math:
Segment 1:
33.7mi*262Wh/mi = 8.83kWh
(ASSUMPTION: you used 43 rated miles, starting at 206, so you ended this segment at 79%, not 78%. Entirely possible since you sat for 20 minutes and who knows what the car was doing during that time. But again, the best thing is to set energy display to distance and take the pictures before and after each segment.)
So you used 21% of your range for that segment (not 22%).
Segment 2:
65.2mi * 255Wh/mi - 8.83kWh = 7.80kWh
This used 20% of your range (there is error on this, again, since you are not set to distance display).
I will assume you used 38 rated miles for this segment (18-19%) (we will never know). The 20% used suggests closer to 41 rated miles were used. But this is within the margin of error, given that you have % display set.
Summary:
Looks to me like you used about 16.63kWh while driving, and used about 1kWh when parked (this "while parked number is an unnecessary
guess; in future you can just get the proper pictures and configuration, and we don't have to guess about the energy used while parked - we'll just know it based on the change in
rated miles while parked (
not the % - can't use %)).
This used 42% of your battery (not including the buffer):
(16.63kWh+1kWh)/0.42/0.99 = 42.4kWh. (The 0.99 factor accounts for the 1% low reading on the trip meter relative to ScanMyTesla readings.)
If you include the buffer:
42.4kWh/0.955 = 44.4kWh
44.4kWh/219Wh/rmi = 203 rated miles (close to your actual 206 rated miles)
Again, all very rough, but looks very consistent with a battery with 45kWh remaining, ~43kWh of which is available above 0%.
If you get all of the errors resolved in your data capture, we can analyze again. Summary:
1) Miles! Not %. Log your 100% rated miles number (it changes (generally gets smaller), so have to charge to 100% before running this experiment, and make a note of the value).
2) Trip meter: Since x:xx. (not since last charge)
3) Pictures
before and
after each segment, ideally IMMEDIATELY before and after exiting/entering Park.
4) Do a discharge to 20% following above procedure, and crunch the numbers. (I expect they'll extrapolate to about 43kWh not including the buffer, after inflation by 1% due to trip meter "inaccuracy.")
But I imagine Tesla will tell you your battery is just fine. Looks like about 7-8% capacity loss to me. Seems normal given the age of the vehicle. Your situation looks fine. Just have to be careful on long Supercharger legs.