


Welcome to Tesla Motors Club
Discuss Tesla's Model S, Model 3, Model X, Model Y, Cybertruck, Roadster and More.
Register
Install the app
How to install the app on iOS
You can install our site as a web app on your iOS device by utilizing the Add to Home Screen feature in Safari. Please see this thread for more details on this.
Note: This feature may not be available in some browsers.
-
Want to remove ads? Register an account and login to see fewer ads, and become a Supporting Member to remove almost all ads.
You are using an out of date browser. It may not display this or other websites correctly.
You should upgrade or use an alternative browser.
You should upgrade or use an alternative browser.
Range Loss Over Time, What Can Be Expected, Efficiency, How to Maintain Battery Health
- Thread starter KK_RedM3
- Start date

Did the range show what you thought it should show...or did it recalibrate another value ?Charged up our M3 SR LFP (Aug 29th pick-up date) during a road trip last week. At 99% it showed that "Calibration" was going on (V2 charger). After calibration the battery showed 100%.
For what it's worth...
Rich
RichAZ/CapeCod
Member
Only checked the SoC percent. Next time it does that I'll note the indicated range.Did the range show what you thought it should show...or did it recalibrate another value ?
Rich
AlanSubie4Life
Efficiency Obsessed Member
Super babied battery where sometimes it will sit at 30% or less for days in garage. Extrapolated range from battery icon calculation on my M3P now says 100% would extrapolate to 288miles.
North Rim meadows. Vermin. All need to be eliminated.Not sure where that beefalo is lol.
You don’t know what it is until you charge to 100% in any case. The extrapolation from 30% is nearly meaningless since it has huge rounding error. After you do that, you can confirm if you wish at some point.It’s the M3P “degradation” that bothers me most actually considering it’s so new.
RichAZ/CapeCod
Member
Just checked. 100% showing as 271 miles. When new was 273 (800 miles ago).Only checked the SoC percent. Next time it does that I'll note the indicated range.
Rich
Rich
FirstInTown
Member
6-2022 MX LR owner. No info like this in the MX forum, so question, does this 'over 55%' storage aging occur with 18650 NCA cells like the NCA cells in the 3/Y? If so, this is REALLY good info to have as our X sits during the week and gets used mostly weekend in the summer. I have a Volt and the montra there is Always Be Charging (ABC). Maybe not for calendar aging, didn't know. But I care more about this on the X than the Volt as the Volt has LARGR buffers at 0 and 100. But I was always charging the X to 70 or 80 and letting it sit for the week. Lately been going 50 % and charging On the weekend as needed higher. That sounds like a good thing.Down below, a chart showing how NCA degrades from time x SOC x temperature.
View attachment 839278
We can see that low SOC is good, contrary to most forum rumors about ”minimum 20%”.
We also see that 100% is not that bad as the rumor days compared to 80-90%.
-When the cars is not in use, Low SOC preserves the battery. Its good to stay low and charge just before a drive, specially if going above 55% SOC.
-Smaller cycles cause much less wear (even per miles driven). Charge often makes one use small cycles*.
Any info on how this calendar aging affects S/X would be appreciated. Thanks.
6-2022 MX LR owner. No info like this in the MX forum, so question, does this 'over 55%' storage aging occur with 18650 NCA cells like the NCA cells in the 3/Y? If so, this is REALLY good info to have as our X sits during the week and gets used mostly weekend in the summer. I have a Volt and the montra there is Always Be Charging (ABC). Maybe not for calendar aging, didn't know. But I care more about this on the X than the Volt as the Volt has LARGR buffers at 0 and 100. But I was always charging the X to 70 or 80 and letting it sit for the week. Lately been going 50 % and charging On the weekend as needed higher. That sounds like a good thing.
Any info on how this calendar aging affects S/X would be appreciated. Thanks.
If you pour through the entire thread, the batteries it most references are NCA, NCM, and LFP which are the chemical composition of the battery. The 18650 name is just to designate a form factor. I have a hybrid work situation so sometimes, my car doesn't get driven on weekdays to I just charge to 55% and go higher on weekends if I need more range.
Hope this helps.
6-2022 MX LR owner. No info like this in the MX forum, so question, does this 'over 55%' storage aging occur with 18650 NCA cells like the NCA cells in the 3/Y?
Any info on how this calendar aging affects S/X would be appreciated. Thanks.
Actually most part of the research is done with Panasonic 18650 NCA. As the form factor do not have any noticeble impact, it is the chemistry that is tested.
2170 has lower Cobalt share than the older 18650. The 2170L has even less.
As Cobalt stabilizes the chemistry, the research reports from Panasonic 18650 NCA probably is closer to the S/X batteries than 2170 for 3/Y. But as we can se the differences between different chemistry is not very big and small changes in the same chemistry probably behaves about the same. So for user level, that is good enough.
I’d say 55% is the correct value to remember.
Background:
In the battery research they found/ do find that the sharp step is at about 57-58% (central graphite peak). Thats is true SOC, and the car underread compared to the true SOC due to the buffer below zero.
55% on screen SOC is (4.5 + 55x0.955) = 57% true SOC.
Calendar aging NCA
Hi AAKEE, do you know if the LG75 battery in the made in China M3LR has a buffer? All my calculations about my range makes me think that 100% of the 75kWh are available to the driver.Actually most part of the research is done with Panasonic 18650 NCA. As the form factor do not have any noticeble impact, it is the chemistry that is tested.
2170 has lower Cobalt share than the older 18650. The 2170L has even less.
As Cobalt stabilizes the chemistry, the research reports from Panasonic 18650 NCA probably is closer to the S/X batteries than 2170 for 3/Y. But as we can se the differences between different chemistry is not very big and small changes in the same chemistry probably behaves about the same. So for user level, that is good enough.
I’d say 55% is the correct value to remember.
Background:
In the battery research they found/ do find that the sharp step is at about 57-58% (central graphite peak). Thats is true SOC, and the car underread compared to the true SOC due to the buffer below zero.
55% on screen SOC is (4.5 + 55x0.955) = 57% true SOC.
Calendar aging NCA
I am interested because I also charge to 55% and don’t include a buffer in my calculations
Thanks
The LG 74.5kwh (E5D or E5CD) also use the 4.5% buffer just as the other battery option does.Hi AAKEE, do you know if the LG75 battery in the made in China M3LR has a buffer? All my calculations about my range makes me think that 100% of the 75kWh are available to the driver.
I am interested because I also charge to 55% and don’t include a buffer in my calculations
Thanks
I guess you either have a faulty calc or a bigger battery.
How did you come up with your theory/values?
I use every formula on this thread....Wh/km X range / % of charge...also the predicted charge from the battery icon plus the occasional 100% charge. Also my real world range matches all these figures. And I get between 74.2kWh to 75kWh (sometimes a little more). But I have never taken the charge down to 0% or (I think about 10% is my lowest)The LG 74.5kwh (E5D or E5CD) also use the 4.5% buffer just as the other battery option does.
I guess you either have a faulty calc or a bigger battery.
How did you come up with your theory/values?
I am also certain that I have the LG75 using the VIN number with 7th letter ‘E’ which is NMC
Last edited:
The energy app includes the buffer. You’re supposed to se around 75kWh.I use every formula on this thread....Wh/km X range / % of charge...also the predicted charge from the battery icon plus the occasional 100% charge. Also my real world range matches all these figures. And I get between 74.2kWh to 75kWh (sometimes a little more). But I have never taken the charge down to 0% or (I think about 10% is my lowest)
I am also certain that I have the LG75 using the VIN number with 7th letter ‘E’ which is NMC
The 7th digit E means litium ion battery. (Lithium ion includes all different chemistries like NCA and NMC).
All LR and P has the 7th = E. My M3P 2021 with the panasonic 2170L 82kwh also has the E.
AlanSubie4Life
Efficiency Obsessed Member
Yes, as @AAKEE says that calculation ends up including the buffer.I use every formula on this thread....Wh/km X range / % of charge...also the predicted charge from the battery icon plus the occasional 100% charge. Also my real world range matches all these figures. And I get between 74.2kWh to 75kWh (sometimes a little more). But I have never taken the charge down to 0% or (I think about 10% is my lowest)
I am also certain that I have the LG75 using the VIN number with 7th letter ‘E’ which is NMC
If you meter your usage carefully, you’ll find each rated mile displayed contains about 4.5% energy less than that implied by the charging constant. (Actually I find it to be closer to 5.5% less but that is a different topic.)
It all works out. Energy screen is weird in a number of ways. It does not imply the amount of energy above the buffer, nor does it imply the energy including the buffer. The calculations there give an energy value containing x% of the buffer where x is your current SOC.
Just look at that trip meter for a long trip, look at % used, extrapolate, and you’ll get a value that does NOT include the buffer. Guaranteed.
Candleflame
Active Member
The LG 74.5kwh (E5D or E5CD) also use the 4.5% buffer just as the other battery option does.
I guess you either have a faulty calc or a bigger battery.
How did you come up with your theory/values?
i have actually forgot about the LG battery. Whats the degradation/range of those? Bit unfair how you get like 6 less kwh with them.... thats like 40km less range.
Macb00kemdanno
Member
My range has been shooting downward quickly as I approach 20,000 miles. Started with a max range of 263 miles, and now down to 236 with a 2021 Model 3. Just last month; I was getting around 245 to 247 miles (as stated in the Tesla app and Tessie). Now it says 242 at max charge. Funny thing is, I used to charge to 90% daily, and some here said charge to 80% daily instead. I started charging to 80% and that’s when it sharply decreased. I’ll try not to worry about it too much, and hope that it levels off soon.


I think he called it: "as stated in the Tesla app and Tessie"What app is that?
Resist
Active Member
That doesn't look like anything in my Tesla app.I think he called it: "as stated in the Tesla app and Tessie"
the operative words were "and Tessie"That doesn't look like anything in my Tesla app.
Hopefully someone reads this at the end of all these pages of posts. Noobie so didn’t want to start new thread.
Bought used 2020 M3LR 19” sport wheels, June build Fremont. Has 32k miles. Read and watched battery degradation stuff till my eyes bled.
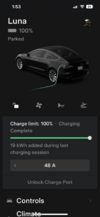
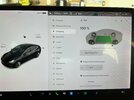
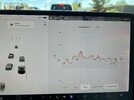
Car was reset to factory when used purchase was made. Been charging to 80% each night with Tesla Wall Charger. Today I wanted to see roughly him many miles I would get at 100% SOC as I bought for road tripping in retirement. See pictures attached. 277 miles at 100%. What am I not understanding or did I buy a used Tesla with major battery degradation?
Bought used 2020 M3LR 19” sport wheels, June build Fremont. Has 32k miles. Read and watched battery degradation stuff till my eyes bled.
Car was reset to factory when used purchase was made. Been charging to 80% each night with Tesla Wall Charger. Today I wanted to see roughly him many miles I would get at 100% SOC as I bought for road tripping in retirement. See pictures attached. 277 miles at 100%. What am I not understanding or did I buy a used Tesla with major battery degradation?
Attachments

Similar threads
- Replies
- 43
- Views
- 3K
- Replies
- 1
- Views
- 64
- Replies
- 10
- Views
- 486
- Replies
- 13
- Views
- 538
- Replies
- 3
- Views
- 159