Seems like more experimentation is needed after discussion above. Seems like setting follow distance to 1 and using AP a bit for a short segment over 50mph would be interesting.
I’m not entirely convinced Tesla is calculating the overall averages correctly either. They can’t average the percentages of course and they may be ignoring 0% in the individual segment reports.
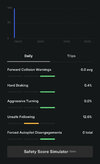
For example, I have taken 5 segments today. The first and the third were the longest, equal length, 0% score on one, 7.3% on the other long one. The fourth segment was fairly short and I got a 2.4%. My average is suspiciously 4.9%. This is the average of 2.4% and 7.3%. (4.85%, an invalid calculation in any case most likely; you cannot average averages)
Mathematically it is possible that this is a coincidence due to the way events and the ratios are counted…but suspicious:
(All approximate below, does not quite add to 46 since they do not report individual segment lengths I had to estimate.)
Trip 1: 11 miles. 0%. Freeway, lots of following events.
Trip 2: 2.5 miles. 0%, no events, surface streets.
Trip 3: 13.5 miles. 7.3%. Freeway, lots of following events.
Trip 4: 7.7 miles. 2.4% freeway, small amount of following events.
Trip 5: 10.1 miles. 0%, freeway, lots of following events.
Something to keep an eye on anyway. It is a Beta after all. With three numbers rather than two non-zero if it is still the simple average of the averages that would be increasingly unlikely to be correct unless all the segments are very similar…
View attachment 714360View attachment 714361View attachment 714362