The 20% rule has held up much better than support levels over the last two years. Read through the last 4 months on this thread.
Unfortunately, because the risk is low, so is the premium, around $2/wk (<0.25%) for a CC right now. If I was selling BPS, BCS or ICs, definitely best to stay 20% OTM. Also, if I had 10,000+ shares that premium would be plenty for me, but alas I didn’t buy 2000 shares at the IPO, so I’m selling CCs closer to 10% OTM and CSPs near ATM. As
@Yoona said, CCs have worked great for the past few weeks, but I had to push my weekly CSPs out to 5/20.
Separating the long term buy-n-hold related factors, from the short term (<2 week in my world), has been one of the developments in my own approach. It's just too easy for me to see the amazing long term view of things, and get caught up in why that long term view isn't manifesting today in the share price.
This is also something I’ve learned this year with all the massive SP shocks (Hertz bump, Elon selling, Twitter, macro dumps). I’m in too much of a hurry to accumulate more shares before the next SP jump that I sell CCs too early and/or too close to ATM. Options selling is like real estate and comedy: location and timing timing timing.
So, weekly recap, charts and thoughts for next week: Challenging trading for me, too many badly-timed trades with the FOMC drop, spike, drop action. Once again lost money on BUYING calls at the wrong time, so I should just stop that craziness. Still, managed to net 5 figures which helped pay for 20 shares. A very profitable week, but now, once again, my cash is depleted and I really need a SP rise to $980+ to help my 5/20 puts. Unfortunately, I don’t think we will get that turnaround just yet, probably another 4-5 wk.
First, SPY chart shows a nice 400-405 gap from almost exactly 1y ago. We tested 405 twice, and it’s only another 2-3% down, so an easy breach. I would bet on that.
Second, the QQQ shows a nice round 300 resistant that also goes back 1+ year. We already breached the 318 line from this March and last May. Again, similar easypeasy 3% drop needed to breach 300.
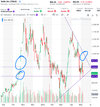
Finally, TSLA chart isn’t quite as definitive but it looks like we have more to drop before a reversal. We filled the gap down to $844, but it wasn’t much of a touch, or gap either for that matter. Our last bounce up was only to 950+/- which definitely looks pathetic with respect to the previous month. Direction is very unclear as bears and bulls fight for control. I expect at least another week at $850-$900, then likely testing $800-$850. Be careful out there, much of the market looks “ready” for a reversal, but TSLA looks more likely still on a downward trend. With outstanding $970-$1000 CSPs for 5/20, I am definitely positioned for a rebound, so that means it won’t happen.


 .
.