Welcome to Tesla Motors Club
Discuss Tesla's Model S, Model 3, Model X, Model Y, Cybertruck, Roadster and More.
Register

SMT: Nominal Full Pack tracking

This site may earn commission on affiliate links.
Still searching for that elusive data from someone who installs SMT right away when they get their car, with a brand new battery, showing:
1) 322 miles, to see what it says about the energy at that point (essentially, by how much it exceeds 77.8kWh).
2) And then observe the behavior for the next couple months, showing that you lose capacity, but it continues to show 322 miles, until it drops below about 77.7kWh (100Wh below 77.8kWh)
3) And confirm that that 322 miles still clicks off right away when you start driving, indicating the miles are larger, not that there is energy above 322 miles.

Would be good to confirm that behavior at some point. Though I think at this point it's pretty likely that's how it will work.

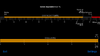
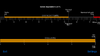
The oldest data point I have is from Feb 2020, when the car was 2 month old, with about 1500 miles, it had 77.2 kw/h back than.

It is down to 76.6 now with close to 3k on odo.

20200220_100216.jpg
 
Last edited:
Found a screenshot from late January.
Car was estimating 319 miles range back than.

This is like 20 days and maybe 300 miles before I took the 77.2 kw screenshot.

View attachment 544043

Unfortunately that estimate does not help us because the low SoC means too much error on the extrapolated estimate. It could easily have been 320 miles at 100%.

Thanks for the other info too! That’s exactly what we’d need, but unfortunately you didn’t start with a super great battery (or you didn’t catch it quite early enough, when your car was showing 322 miles, when it was around 77.8kWh). We need someone who starts doing this with a really solid 322 rated miles (which should show at least 77.8kWh according to the theory).

For your 77.2kWh reading, I would expect it would have showed about 320 rated miles with 18” wheels at 100%, because 241Wh/rmi18 * 320 rmi18 = 77.1kWh.
 
I have both 2020 MS and 2020 M3 ,Does SMT not show the same info for both cars?
For example, I don't have "range" stuff showing on M3 scan .
It also appears that the M3 does not show "usable pack" info .

Just wondering, in general, should I expect to see slightly different items between the lists or is something wrong?

Thanks

PS-just to be clear please , "nominal full pack" is the BIG battery item top watch correct? This is how we determine degradation?
Yes, they do show less information for the M3 than the MS on Scan My Tesla. But it doesn't matter since you still get enough information from the M3 scan to get what you need from it.
For example, the rated miles you can get directly from your car screen. And the usable remaining is simply calculated from the nominal full pack value minus the buffer, which is provided by SMT for the M3.

The nominal full pack will track your degradation proportional to your 100% rated miles degradation, at least as long as your car's full rated miles are less than the specified new car rated miles, which is probably most cases.
 
I started tracking my Nominal Full Pack with SMT on 4/26 and it initially displayed 72.5 kWH and 309 range miles. Over the next month and limited driving, and 50-80% charging it dropped as low as 71 kWH and 303 miles.

I charged to 100% and 306 range miles on Tuesday night. SMT displayed 71.6 kWH and 307 miles the next morning. Today it displays 72.6 kWH and 310 range miles.

Good to see that after the 100% charge that SMT reflects the BMS recalibration. Not that I expected anything different but it is just good to verify.
 
  • Like
Reactions: Pluglife
I started tracking my Nominal Full Pack with SMT on 4/26 and it initially displayed 72.5 kWH and 309 range miles. Over the next month and limited driving, and 50-80% charging it dropped as low as 71 kWH and 303 miles.

I charged to 100% and 306 range miles on Tuesday night. SMT displayed 71.6 kWH and 307 miles the next morning. Today it displays 72.6 kWH and 310 range miles.

Good to see that after the 100% charge that SMT reflects the BMS recalibration. Not that I expected anything different but it is just good to verify.

All makes sense with the 234Wh/rmi constant of the LR RWD 2018. 1.6kWh seems reasonable for the amount of variation on the estimate you might see (though a portion of it might be real (but temporary) from temperature changes). No sure whether or not you've had any significant cold spells in the last month (didn't it snow in the northeast in May? - though probably not as cold in NC) - might explain the 71kWh if it was coincident with that chilly time.

Seems like it may have had a chance to rebalance your weakest cell and leak it down a bit, followed by topping up the entire pack again. On the top up, that would have resulted in higher voltages on all the other less weak cells (while the weakest would charge up again to max voltage), which would result in slightly more voltage at 100% (and thus energy) available from the pack. Did you happen to note what happened to the pack voltage between the [email protected] and [email protected]? (And the max & min cell voltages in the two states?) I'd expect the 310 to have about 3-4V higher pack voltage, and there to be a notably higher min voltage (about 30mV higher). But that actually seems like a lot of imbalance (never seen more than a few mV in pictures posted here) so in some sense I would not be surprised if you saw nothing of the sort...and the 1kWh increase may be due to some other factor or estimate adjustment.
 
Last edited:
All makes sense with the 234Wh/rmi constant of the LR RWD 2018. 1.6kWh seems reasonable for the amount of variation on the estimate you might see (though a portion of it might be real (but temporary) from temperature changes). No sure whether or not you've had any significant cold spells in the last month (didn't it snow in the northeast in May? - though probably not as cold in NC) - might explain the 71kWh if it was coincident with that chilly time.

Seems like it may have had a chance to rebalance your weakest cell and leak it down a bit, followed by topping up the entire pack again. On the top up, that would have resulted in higher voltages on all the other less weak cells (while the weakest would charge up again to max voltage), which would result in slightly more voltage at 100% (and thus energy) available from the pack. Did you happen to note what happened to the pack voltage between the [email protected] and [email protected]? (And the max & min cell voltages in the two states?) I'd expect the 310 to have about 3-4V higher pack voltage, and there to be a notably higher min voltage (about 30mV higher). But that actually seems like a lot of imbalance (never seen more than a few mV in pictures posted here) so in some sense I would not be surprised if you saw nothing of the sort...and the 1kWh increase may be due to some other factor or estimate adjustment.

The weather in NC has been pleasant during this time with highs in the 70-80 range and lows in the 55-65 range. So no cold weather or enough change to be significant.

I have the new SMT Apple version so the only voltage I have is Min, Mid and Max cell voltage. I only recorded the cell voltages a couple of times during the recording of the battery capacity. At 71.1 and 72.6 kWH.

View attachment 545486
 

Attachments

  • 1EDA26F9-8CDC-4BC2-8A68-CAA023BC0BDC.png
    1EDA26F9-8CDC-4BC2-8A68-CAA023BC0BDC.png
    47 KB · Views: 241
  • FE522D45-1059-4845-9DC6-2B5F374AB23B.png
    FE522D45-1059-4845-9DC6-2B5F374AB23B.png
    48.2 KB · Views: 278
Last edited:
The weather in NC has been pleasant during this time with highs in the 70-80 range and lows in the 55-65 range. So no cold weather or enough change to be significant.

I have the new SMT Apple version so the only voltage I have is Min, Mid and Max cell voltage. I only recorded the cell voltages a couple of times during the recording of the battery capacity. At 71.1 and 72.6 kWH.

View attachment 545486

Yeah. Kind of what I would have expected. At most 10mV difference, and that’s after some discharge where you might expect some, due to differences in brick capacities. Guess that estimate can swing around by 1.5kWh or so. But not enough to explain the 30+ miles of loss some people see, for sure.
 
  • Like
Reactions: jdcollins5
What is exactly 'Nominal Full pack'?
trying to figure out some of the other values, is information somewhere searchable? what is for example the difference in 'nominal kWh remaining' versus 'expected kWh' ?

Nominal Full Pack is your current battery capacity in kWH at full charge, You can compare this to the rated capacity of your car when new to determine true degradation percentage.

The nominal kWH remaining is the current capacity after driving and reduced SOC. The expected kWH, I would think, is what the BMS algorithm is expecting to see.

The Scan My Tesla website has a spreadsheet that has some information to help explain some of the names, but not much. I would also like to find more information that will explain more of the data names.
 
  • Informative
Reactions: nico180
What this nominal full pack means?
I got my car Model 3P summer 2021. Now I checked this nominal full pack is 74.8KWh and full when new is 82KWh.
Do I have already lost so much battery? Buffer was something little bit over 3KWh.
 
What this nominal full pack means?
I got my car Model 3P summer 2021. Now I checked this nominal full pack is 74.8KWh and full when new is 82KWh.
Do I have already lost so much battery? Buffer was something little bit over 3KWh.
Nominal full pack means if you filled battery from 0 to 100% it would take 74.8 kWH.

There is a 3.2 kWH buffer to allow for driving below 0 miles in an emergency. So 82 kWH - 3.2 = 78.8 kWH which is now considered the When New value of your battery.

So 74.8/78.8 = 0.949. Your battery has a degradation loss of 5%.
 
  • Disagree
Reactions: AlanSubie4Life
Nominal full pack means if you filled battery from 0 to 100% it would take 74.8 kWH.

There is a 3.2 kWH buffer to allow for driving below 0 miles in an emergency. So 82 kWH - 3.2 = 78.8 kWH which is now considered the When New value of your battery.

So 74.8/78.8 = 0.949. Your battery has a degradation loss of 5%.
That is lot when consider that I have only drove under 22000km.
Need to follow.
 
Nominal full pack means if you filled battery from 0 to 100% it would take 74.8 kWH.

That’s incorrect. Nominal full pack includes the buffer. 0-100% is 95.5% of NFP.

So 82 kWH - 3.2 = 78.8 kWH which is now considered the When New value of your battery.
The 82.1kWh is a hard-coded value for 2021 Model 3 P. Doesn’t represent reality. These vehicles typically start at about 81kWh including the buffer, so nominal full pack is about 81kWh when new. They started showing capacity loss below about 80.7kWh.

If NFP is 74.8kWh that’s about 7.5% capacity loss (assuming about 80.7kWh starting capacity) which of course is quite common in 6-9 months.

SMT has another field for remaining energy not including the buffer, I think…something like usable remaining or something like that, as I recall (I do not have SMT).
 
  • Informative
  • Like
Reactions: KenC and thinger
That’s incorrect. Nominal full pack includes the buffer. 0-100% is 95.5% of NFP.


The 82.1kWh is a hard-coded value for 2021 Model 3 P. Doesn’t represent reality. These vehicles typically start at about 81kWh including the buffer, so nominal full pack is about 81kWh when new. They started showing capacity loss below about 80.7kWh.

If NFP is 74.8kWh that’s about 7.5% capacity loss (assuming about 80.7kWh starting capacity) which of course is quite common in 6-9 months.

SMT has another field for remaining energy not including the buffer, I think…something like usable remaining or something like that, as I recall (I do not have SMT).
I am just following Scan My Tesla data for Nominal Full Pack and When New for my 2018 LR RWD. When New is listed as 78.8 kWH, which is 82-3.2 (buffer).
 
I am just following Scan My Tesla data for Nominal Full Pack and When New for my 2018 LR RWD. When New is listed as 78.8 kWH, which is 82-3.2 (buffer).
Full Pack When New is a hard-coded value in SMT based on your model type, not your actual car. Don’t even pay attention to that value as every pack is different coming out of the factory.

Nominal Full Pack is your actual car’s total pack’s capacity, including the buffer (typically 4.5% of that full pack value).

If you charge to 100%, you’ll find that Nominal Remaining = Nominal Full Pack, and Usable = Nominal Remaining - Energy Buffer.
What reference value do you use when calculating degradation?
 
Nominal Full Pack and When New for my 2018 LR RWD.

When New is listed as 78.8 kWH, which is 82-3.2

Sure. Just out of curiosity - are you sure it is 78.8kWh, not 77.8kWh? That would be interesting but LR RWDs are rare so perhaps it is (I always thought it was the same as the LR AWD (77.8kWh)...but again really very few SMT captures on LR RWD).

In any case, as has been said, Full Pack When New is just a hard-coded value and is not particularly relevant for any metric - though for older vehicles it more closely aligned with the actual NFP when new. For the 2021 LR AWD in particular, it tends to be strongly mismatched (82.1kWh for models later in the year, and NFP starts around 79-80kWh...whereas for the 2021 LR AWD earlier in the model year it was 77.8kWh and started at around 78kWh...and for the Performance 2021 it was always 82.1kWh FPWN and ~80.5kWh-81kWh NFP when new for most vehicles). This FPWN value is discussed in the FAQs on the SMT website.

Definitely FPWN should be ignored when looking at and calculating capacity loss - unless it happens to align with the NFP when the vehicle was new.

In any case, your car likely started around 78kWh (this is based on other vehicles) and that 78kWh includes the buffer (as you can easily see yourself from your SMT captures, by looking at SOC %, nominal remaining, and buffer size, at a variety of SOCs).

What reference value do you use when calculating degradation?

You have to use the NFP when your vehicle was new. If you don't know that, you have to piece together evidence from other vehicles of where your vehicle may have started, which at best will be an approximation, as all vehicle packs are slightly different.
 
Last edited:
  • Like
Reactions: jdcollins5
What reference value do you use when calculating degradation?
The first value you see in Nominal Full Pack (NFP) when you first take delivery.

To illustrate this in my latest example: took delivery of my Plaid on 8/27/2021. NFP was 97.0 kWh despite Full Pack When New stating 99.4 kWh.

Today, my NFP shows 96.1 kWh. So degradation is just 97.0 - 96.1 = 0.9 kWh, or 0.9/97.0 = 0.93% degradation.

Doing the same math on the hard-coded 99.4 kWh value would incorrectly show much higher degradation of 3.3%. But my pack never had 99.4 kWh, it started off at 97.0 kWh.