I am working on a system to incorporate a battery pack from a Tesla Model S into a Solar system for the home. This uses the entire pack from salvage as is.
Yesterday, I discharged the pack down to about 1.4% state of charge using a 20kW inverter to the point where the internal BMS master board disconnected the internal contactors.
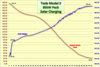
And subsequently I charged it to about 92% SOC using 40 Panasonic HIT panels in our test array. The controller software allows me to log voltage, amp hours and state of charge each minute so I made a graph showing the charge curve.
It's kind of interesting, so I thought I would share it here.
I was surprised that there really isn't anything left below about 320v on these packs. But at 226Ah used to 1.4% I think we are pretty close with the 230Ah estimate for pack capacity.
The jaggies are of course caused by passing clouds decreasing the power output of the array.
Yesterday, I discharged the pack down to about 1.4% state of charge using a 20kW inverter to the point where the internal BMS master board disconnected the internal contactors.
And subsequently I charged it to about 92% SOC using 40 Panasonic HIT panels in our test array. The controller software allows me to log voltage, amp hours and state of charge each minute so I made a graph showing the charge curve.
It's kind of interesting, so I thought I would share it here.
I was surprised that there really isn't anything left below about 320v on these packs. But at 226Ah used to 1.4% I think we are pretty close with the 230Ah estimate for pack capacity.
The jaggies are of course caused by passing clouds decreasing the power output of the array.