Welcome to Tesla Motors Club
Discuss Tesla's Model S, Model 3, Model X, Model Y, Cybertruck, Roadster and More.
Register

Solar Inverter Undersize

This site may earn commission on affiliate links.
System info:

Solar Panels: 43 of 425watt = 18,275 watts
Solar Inverts: 3 of Delta M4-TL-US = 12,000 watts.
Battery: 3 PowerWall 2 = 40.5 KW Storage

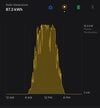
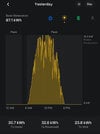
I understand that Tesla do clipping to maximize production but my system is doing to much, from 10am - 3:30 my solar output is max out to 12.2kwh either sunny day or cloudy day… i believe that if they put the right size of inverter i will gain about 8-15 more kw production… on a good day while watching the gateway web i seen alot the system will go up to 13.7 kwh but it will go back down to 12.2kwh. My system is being limited because of the inverter they put on.
Also I didn’t get my inspection or PTO yet but my system is already selling to the grid when all my battery are charged up… I don’t see the notifications like everyone have “Self-Consumption Only” on the app…


Sunny day
A6C489DC-4FB2-4E79-8F41-DB59E7B63440.jpeg

Cloudy day

4185BA0D-8D21-4DF4-82C8-79D2A33F9D97.jpeg
 
You are correct, many systems are designed with DC to AC ratios exceeding one to one. The most useful way to evaluate how much that will cost is to use kWhs. Did you get an estimate of production for a year? You could compare that to a forecast using PV Watts to see if the difference over a year is significant. That curve is not as flat as my system was when it was clipping.
 
Last edited:
System info:

Solar Panels: 43 of 425watt = 18,275 watts
Solar Inverts: 3 of Delta M4-TL-US = 12,000 watts.
Battery: 3 PowerWall 2 = 40.5 KW Storage

I understand that Tesla do clipping to maximize production but my system is doing to much, from 10am - 3:30 my solar output is max out to 12.2kwh either sunny day or cloudy day… i believe that if they put the right size of inverter i will gain about 8-15 more kw production… on a good day while watching the gateway web i seen alot the system will go up to 13.7 kwh but it will go back down to 12.2kwh. My system is being limited because of the inverter they put on.
Also I didn’t get my inspection or PTO yet but my system is already selling to the grid when all my battery are charged up… I don’t see the notifications like everyone have “Self-Consumption Only” on the app…


Sunny day

View attachment 786555

Cloudy day

View attachment 786554
You have to look at the total amount clipped for the total year. Not just cherry picking a good day on a good part of the season. Then look at the ROI of the added cost of a larger inverter for the few percent gain over the year.

You can’t just add up every panel. Often every panel will never all produce max watts at the same time.

That doesn’t look like it’s clipping much to me. It’s the area under the curve that matters, not the height.
 
  • Like
Reactions: Patrick66
The other unknown is if there were any constraints as far as the ability of the main service panel to handle the extra capacity of another inverter. The cost of upgrading the service panel and another inverter has to be compared to the lost revenue from clipping.
 
You are correct, many systems are designed with DC to AC ratios exceeding one to one. The most useful way to evaluate how much that will cost is to use kWhs. Did you get an estimate of production for a year? You could compare that to a forecast using PV Watts to see if the difference over a year is significant. That curve is not as flat as my system was when it was clipping.
I live in Hawaii, cost of per kw here is around $0.33-$0.40 per kw it depends on season. My bill normally is around $750-$850/month. I asked Tesla to put as much panel they can put on my roof to maximize my saving. Tesla estimated my panel will only produce about 17,733 kWh /yr with their design, which less than I expected, PVwatts.com estimate with the right dc/ac ratio is about 25,000 kwh/yr…
The curve is not as flat when you looking at it but if you scroll on the app around 9:45am system is already putting 12kwh that goes until 3:30-4:00pm.
 
  • Like
Reactions: charlesj
You have to look at the total amount clipped for the total year. Not just cherry picking a good day on a good part of the season. Then look at the ROI of the added cost of a larger inverter for the few percent gain over the year.

You can’t just add up every panel. Often every panel will never all produce max watts at the same time.

That doesn’t look like it’s clipping much to me. It’s the area under the curve that matters, not the height.
I know it’s clipping alot because when i looked at MProfessional data with the delta inverters most of the inverter is producing about AC 5000W but since the inverter is rated output of AC 3800W-4000W thats 3kw /h for 3 inverters. 3*5= 15…
During this month is mostly cloudy and raining day, if we hit summer would be more losses in my opinion…
You won't produce that much more in summer. Spring can be some of the best months because the panels are still cool.
As ambient temps climb the efficiency drops. Now maybe in Hawaii the numbers are a little different than the northeast.
The best production is either side of Summer Solstice (more on the leading side because of cooler temps, like right now) not the warmest time of year.
And warmest times of year in some places get hazy or rainy. You have to look at the whole year.
You might lose 5% in total for the year even though you'll see "cherry picked" days that might lose 15%.
 
  • Like
Reactions: no2gates
You won't produce that much more in summer. Spring can be some of the best months because the panels are still cool.
As ambient temps climb the efficiency drops. Now maybe in Hawaii the numbers are a little different than the northeast.
The best production is either side of Summer Solstice (more on the leading side because of cooler temps, like right now) not the warmest time of year.
And warmest times of year in some places get hazy or rainy. You have to look at the whole year.
You might lose 5% in total for the year even though you'll see "cherry picked" days that might lose 15%.
Hawaii don’t matter the season, summer rain too because weather here is unpredictable the only difference is from April - September has a longer daylight and October- March is much less daylight.
Let say 350-400Kw a month losses but with bigger (right) inverter thats about $120-$150 more to be deducted in my bills..
 
Thanks for the data. Yes, a DC to AC ratio of 1.5 to 1 seems aggressive for that latitude and weather. That could be enough to pay for another inverter out of the savings from the first year based on your data. I had a similar ratio but in Northern California the differences were not that great based on my production forecasts.

The question then is what constraints caused them to restrict the AC capacity. It could be bus bar capacity on the service panel or the matching PV solar capacity to Powerwalls. There are some workarounds for those issues. Did they give you a detailed design document that showed that configuration?
 
Hawaii don’t matter the season, summer rain too because weather here is unpredictable the only difference is from April - September has a longer daylight and October- March is much less daylight.
Let say 350-400Kw a month losses but with bigger (right) inverter thats about $120-$150 more to be deducted in my bills..
You are assuming 100% clipping loss every day. That's not gonna happen.

Maybe you should spend some energy on conserving ;)
 
  • Disagree
Reactions: buckets0fun
Thanks for the data. Yes, a DC to AC ratio of 1.5 to 1 seems aggressive for that latitude and weather. That could be enough to pay for another inverter out of the savings from the first year based on your data. I had a similar ratio but in Northern California the differences were not that great based on my production forecasts.

The question then is what constraints caused them to restrict the AC capacity. It could be bus bar capacity on the service panel or the matching PV solar capacity to Powerwalls. There are some workarounds for those issues. Did they give you a detailed design document that showed that configuration?
When i talked to the Tesla installers he told me that I supposed to get 3 powerwall 2+ With 2 7.6kw Tesla inverter but due to short on supply chain they had to go with (3-4kw) Delta Inverter they have in stock… I believe my 200A service panel should be able to handle a bigger inverters.. the 2-7.6kw inverter would have been nice or 3-5kw delta inverter IMO.
 
When i talked to the Tesla installers he told me that I supposed to get 3 powerwall 2+ With 2 7.6kw Tesla inverter
Perhaps you have a contractual basis for compensation or another inverter, if that is what the final documents said. Have you had a conversation with Tesla installer about this?

To verify your assumptions I found in Northern California a South facing system should produce 1200kWhs for every Watt of installed solar. That is the factor from PV Watts. With your latitude you should be getting a factor of 1350 per Watt of installed solar. For a 18,000kW system that comes out to almost the same number you got from PVWatts. That number takes into account seasons, temperature, local weather and other factors mentioned by @mswlogo above. For these reasons, I disagree with his conclusions. Now that we are past the equinox the effect of clipping should show up more dramatically on your production charts.

Normally I am not too concerned about reasonable clipping and I had a system with a DC to AC ratio of 1.5 to 1. However as I mentioned it was in Northern California. I did the same analysis with PV Watts and had the installere model what a bigger inverter would have produced and the difference in my case came out to only 300kWhs per year which was not worth going to the mat over. I think your case is different and may be worth trying to find a solution,
 
Last edited:
  • Like
Reactions: charlesj
Aloha GRV0928, and welcome to the forums! My sister has a solar system in east Honolulu, so I feel your desire to get out from under HECO's exorbitant rates as much as possible....

One thing you might do to get a better sense is to browse through nearby systems on pvoutput.org, a website where people publish their realtime solar monitoring, and compare to systems of comparable size and orientation (latter is particularly important if comparing the shape of the daily curve, and the daily peak, though most are south-facing). There are few systems of your size, but there are a number around 1/4 the size (4.5kw-ish) and some 1/2 the size (9 kw-ish), which makes it easy to scale up their production.

This link points at a 4.5kw system, and you can click on the dropped pins on the map to find other nearby systems:

Kualono King 4.485kW | Map

Make sure you pick on that has been uploading data recently, many are no longer reporting. That one for "Kualono King" showed this nice sunny day if you click on their Daily production and click on yesterday, 3/26:

live-production-kualono (1).jpeg


Green was their realtime reported data, and if you find the Insolation link, it'll superimpose the blue estimation of their solar insolation (poetential) on a "standard" sunny day. If you scale up this system by 4X to match yours, the 3000W line x 4 then is your 12kw inverter cutoff. Indeed you can see that from about 10am-3pm, as you said they are generating more than 3kw ( x4 = 12kw). So you may be losing out the area of the small hump from their curve above 3000W.

How much is that? Well, their peak was about 3.6kw (x4 = 14.4kw), but the area is harder to calculate. But if you look at the daily total it was 26kwh (x4=102 kwh). Other systems when scaled up show similar peak around 14kw, and daily production from about 100-108 kwh. So your peak may be clipped about 15%, but the actual daily loss is only about 7-10% if the 93kwh from your chart is for 3/26.

But if you get another inverter, if you end up somewhat oversized for the system, you'll also suffer more inefficiencies when you're not near your 18kw peak mid-day. My vague understanding of the current HECO NEM rules is you don't get much for your mid-day export; your morning and later afternoon production may be more valuable to offset usage, if you're already topping out the batteries by mid-day. So something to consider...
 
@GRV0928,
PVWatts gives 25,000KWh annually for HI, assuming all of your panels face South exactly. Are all your panels really facing South? If not, as implied by Tesla's estimated energy of about 18,000kWh, then the time at which peak power output occurs will depend on the panel direction. That has the effect of reducing the power lost to clipping, because the panels in separate directions contribute their peak at different times of the day.
 
If not, as implied by Tesla's estimated energy of about 18,000kWh, then the time at which peak power output occurs will depend on the panel
That is a good point, I had assumed that the Tesla estimate was on the configuration with less inverter capacity. Perhaps @GRV0928 can confirm? If the solar panel configuration is not due south that could effect the calculation of losses due to clipping. If there are east and west facing panels a higher DC to AC ratio might not be all that bad because the solar collection would extend from earlier in the day to later in the day. If I understand his rate scenerio, west facing panels might generate credits during higher rates.
 
Last edited:
Aloha GRV0928, and welcome to the forums! My sister has a solar system in east Honolulu, so I feel your desire to get out from under HECO's exorbitant rates as much as possible....

One thing you might do to get a better sense is to browse through nearby systems on pvoutput.org, a website where people publish their realtime solar monitoring, and compare to systems of comparable size and orientation (latter is particularly important if comparing the shape of the daily curve, and the daily peak, though most are south-facing). There are few systems of your size, but there are a number around 1/4 the size (4.5kw-ish) and some 1/2 the size (9 kw-ish), which makes it easy to scale up their production.

This link points at a 4.5kw system, and you can click on the dropped pins on the map to find other nearby systems:

Kualono King 4.485kW | Map

Make sure you pick on that has been uploading data recently, many are no longer reporting. That one for "Kualono King" showed this nice sunny day if you click on their Daily production and click on yesterday, 3/26:

View attachment 786636

Green was their realtime reported data, and if you find the Insolation link, it'll superimpose the blue estimation of their solar insolation (poetential) on a "standard" sunny day. If you scale up this system by 4X to match yours, the 3000W line x 4 then is your 12kw inverter cutoff. Indeed you can see that from about 10am-3pm, as you said they are generating more than 3kw ( x4 = 12kw). So you may be losing out the area of the small hump from their curve above 3000W.

How much is that? Well, their peak was about 3.6kw (x4 = 14.4kw), but the area is harder to calculate. But if you look at the daily total it was 26kwh (x4=102 kwh). Other systems when scaled up show similar peak around 14kw, and daily production from about 100-108 kwh. So your peak may be clipped about 15%, but the actual daily loss is only about 7-10% if the 93kwh from your chart is for 3/26.

But if you get another inverter, if you end up somewhat oversized for the system, you'll also suffer more inefficiencies when you're not near your 18kw peak mid-day. My vague understanding of the current HECO NEM rules is you don't get much for your mid-day export; your morning and later afternoon production may be more valuable to offset usage, if you're already topping out the batteries by mid-day. So something to consider..
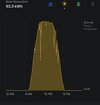
Thats my production yesterday, it was cloudy and raining…
7B0D6911-8A14-48F8-85A0-323C1AA8FC45.jpeg
 
@GRV0928,
PVWatts gives 25,000KWh annually for HI, assuming all of your panels face South exactly. Are all your panels really facing South? If not, as implied by Tesla's estimated energy of about 18,000kWh, then the time at which peak power output occurs will depend on the panel direction. That has the effect of reducing the power lost to clipping, because the panels in separate directions contribute their peak at different times of the day.
95% of my panels facings South and 5
Percent facing Southwest…
 
That is a good point, I had assumed that the Tesla estimate was on the configuration with less inverter capacity. Perhaps @GRV0928 can confirm? If the solar panel configuration is not due south that could effect the calculation of losses due to clipping. If there are east and west facing panels a higher DC to AC ratio might not be all that bad because the solar collection would extend from earlier in the day to later in the day. If I understand his rate scenerio, west facing panels might generate credits during higher rates.
My estimated was about 18000kw/year but my bill usage is about 22000-25000kw/year.. but i told tesla to put as much panel they can fit on my roof to minimize my bills which came out of 43-425 watts… I believe I should have 2-7.6kw tesla inverter (perfect fair with my system) instead of the 3 delta inverter..
 
My estimated was about 18000kw/year but my bill usage is about 22000-25000kw/year.. but i told tesla to put as much panel they can fit on my roof to minimize my bills which came out of 43-425 watts… I believe I should have 2-7.6kw tesla inverter (perfect fair with my system) instead of the 3 delta inverter..
The Tesla estimate seems way too low just for clipping, and they estimated that with the original plan for 15kwbof inverters?

Are you in Manoa or one of the other valleys where you just get a lot more localized showers and clouds compared to the rest of the island? I don't think PVwatts can account for that, but maybe local installers do...