CleanTechnica: Bill Filed to Crush Solar Choice in the Sunshine State (Florida). Bill Filed to Crush Solar Choice in the Sunshine State (Florida)


Welcome to Tesla Motors Club
Discuss Tesla's Model S, Model 3, Model X, Model Y, Cybertruck, Roadster and More.
Register
Install the app
How to install the app on iOS
You can install our site as a web app on your iOS device by utilizing the Add to Home Screen feature in Safari. Please see this thread for more details on this.
Note: This feature may not be available in some browsers.
-
Want to remove ads? Register an account and login to see fewer ads, and become a Supporting Member to remove almost all ads.
You are using an out of date browser. It may not display this or other websites correctly.
You should upgrade or use an alternative browser.
You should upgrade or use an alternative browser.
Solar PV News
- Thread starter mspohr
- Start date
-
- Tags
- solar energy

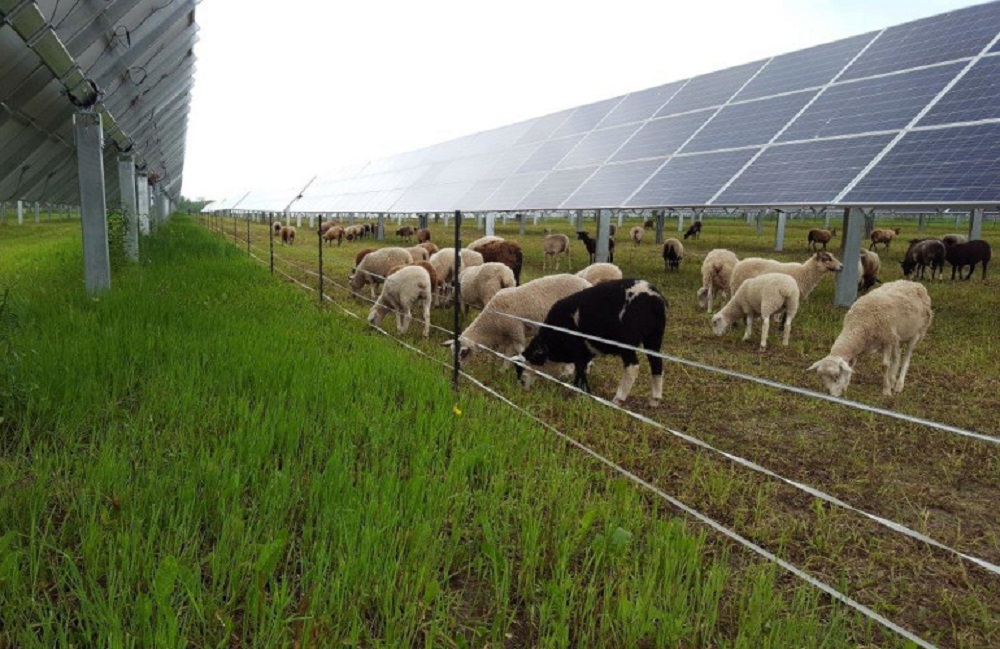
Grazing sheep increase carbon sequestration up to 80%, while also benefiting fixation of soil nutrients under solar panels
Researchers from Temple University have found that managed sheep grazing on an acre of recovering agricultural soil with native plants installed may sequester one ton of carbon per year, which may accumulate for 12 to 15 years before reaching saturation
 pv-magazine-usa.com
Protest planned as Florida net metering bill could “set rooftop solar back a decade”
Under the proposed reduction to the compensation for excess solar generation, 93% of surveyed solar shoppers to say they are no longer interested in buying.
pv-magazine-usa.com
This has led utilities to argue that there has been a “cost shift” to non-solar customers. Paying for solar generation results in what the bill calls “increased cross-subsidization of the full cost of electric service onto the public utility’s general body of ratepayers.” However, today only about 90,000 of the 8.5 million electric customers in Florida are topped with solar. The utility argues that this some 1% of Floridians are creating significant costs for the other 99%. Lawrence Berkeley National Lab’s sixteen large-scale state-level studies on the cost shift argument that may suggest the bill’s assumptions stand on shaky ground. It found that 40 of the 43 states with net metering programs have a negligible cost increase attributable to solar, and the cost picture remains this way until solar penetration reaches 10% of the state’s total generation.

‘Solar and wind deployment could not now be stopped if we wanted to’
BloombergNEF’s Jenny Chase has surveyed the state of affairs in world solar for clean energy journal Joule and said the technology’s historic ability to surmount obstacles – and persistently confound analysts’ predictions – should offer a reason for hope.
pv-magazine-usa.com
Global solar generation capacity could hit around 3.4TW this decade, according to BloombergNEF‘s head of solar analysis Jenny Chase.
Merrill
Merrill
Let’s hope she is correct, no mention of all the utilities trying to stop solar.‘Solar and wind deployment could not now be stopped if we wanted to’
BloombergNEF’s Jenny Chase has surveyed the state of affairs in world solar for clean energy journal Joule and said the technology’s historic ability to surmount obstacles – and persistently confound analysts’ predictions – should offer a reason for hope.
Global solar generation capacity could hit around 3.4TW this decade, according to BloombergNEF‘s head of solar analysis Jenny
Utilities are trying to stop residential solar which cuts into their profits. They are happy to install their own solar which they can sell at a hefty markup.Let’s hope she is correct, no mention of all the utilities trying to stop solar.
SageBrush
REJECT Fascism
Protest planned as Florida net metering bill could “set rooftop solar back a decade”
Under the proposed reduction to the compensation for excess solar generation, 93% of surveyed solar shoppers to say they are no longer interested in buying.
This has led utilities to argue that there has been a “cost shift” to non-solar customers. Paying for solar generation results in what the bill calls “increased cross-subsidization of the full cost of electric service onto the public utility’s general body of ratepayers.” However, today only about 90,000 of the 8.5 million electric customers in Florida are topped with solar. The utility argues that this some 1% of Floridians are creating significant costs for the other 99%. Lawrence Berkeley National Lab’s sixteen large-scale state-level studies on the cost shift argument that may suggest the bill’s assumptions stand on shaky ground. It found that 40 of the 43 states with net metering programs have a negligible cost increase attributable to solar, and the cost picture remains this way until solar penetration reaches 10% of the state’s total generation.
Left unsaid: and when there *is* a price increase, it is from revenue reduction, AKA conservation. The utilities are sooooo FOS
CleanTechnica: Glut of Solar Panels in 2025. Glut of Solar Panels is coming in 2025
As Tony Seba frequently comments – it is the confluence of technology changes that creates the greatest disruptions. A glut of solar panels arriving at the same time as a ramped supply of batteries and electric vehicles will create a massive acceleration of uptake. Here is major step in the rEVolution.
As Tony Seba frequently comments – it is the confluence of technology changes that creates the greatest disruptions. A glut of solar panels arriving at the same time as a ramped supply of batteries and electric vehicles will create a massive acceleration of uptake. Here is major step in the rEVolution.
BGR: Revolutionary new solar panels don’t need sunlight to generate energy.

 bgr.com
But how do you make solar panels that don’t rely on sunlight? Well, you don’t. At least, not entirely. Instead, you make solar panels that can feed off the ultraviolet rays of the Sun that clouds don’t hinder.
Revolutionary new solar panels don’t need sunlight to generate energy
New solar panels that don't need sunlight have been invented and could revolutionize the green energy initiative.
bgr.com
But how do you make solar panels that don’t rely on sunlight? Well, you don’t. At least, not entirely. Instead, you make solar panels that can feed off the ultraviolet rays of the Sun that clouds don’t hinder.
Solar Tsunami: Solar PV grows 26% again – stays exponential as it blows past 4% of US electricity in 2021
Solar continues its march to take over the US electricity system, as five states meet more than 10% of in-state demand with solar PV, while another six states more than doubled their solar generation.
 pv-magazine-usa.com
Solar photovoltaics represented over 4% of the electricity generated in the United States in 2021, according to the latest data from the U.S. Department of Energy’s Energy Information Administration (EIA). The February 2022 edition of the EIA’s Electric Power Monthly shows the electrons set loose by solar panels growing 26% during the year, following on similar growth in the previous year.
While 4.24% of power shows tremendous progress over the past few years, solar is not stopping there. EIA expects the United States to install 21.5 GWac of solar this year. Even with the projects already under construction we can expect another big increase in electricity from solar this year, and again next year, as part of renewable energy displacing fossil fuels to take over the U.S. power system.
ItsNotAboutTheMoney
Well-Known Member
MW of planned additions as listed by the EIA. The short lead time means that there's little info on some tech even to the mid-term.Solar Tsunami: Solar PV grows 26% again – stays exponential as it blows past 4% of US electricity in 2021
Solar continues its march to take over the US electricity system, as five states meet more than 10% of in-state demand with solar PV, while another six states more than doubled their solar generation.
Solar photovoltaics represented over 4% of the electricity generated in the United States in 2021, according to the latest data from the U.S. Department of Energy’s Energy Information Administration (EIA). The February 2022 edition of the EIA’s Electric Power Monthly shows the electrons set loose by solar panels growing 26% during the year, following on similar growth in the previous year.
While 4.24% of power shows tremendous progress over the past few years, solar is not stopping there. EIA expects the United States to install 21.5 GWac of solar this year. Even with the projects already under construction we can expect another big increase in electricity from solar this year, and again next year, as part of renewable energy displacing fossil fuels to take over the U.S. power system.
| Year | Solar Photovoltaic | Batteries | Onshore Wind Turbine | Offshore Wind Turbine | Natural Gas Fired Combined Cycle | Natural Gas Fired Combustion Turbine |
|---|---|---|---|---|---|---|
| 2022 | 21730.3 | 6114.2 | 9778.3 | 0 | 7938 | 1402.4 |
| 2023 | 18950.8 | 4221 | 5180.2 | 0 | 4270.8 | 1835.4 |
| 2024 | 7847.4 | 2642.5 | 2681.9 | 1920.4 | 2732.1 | 517 |
| 2025 | 1038 | 30 | 2102 | 0 | 6113.2 | 11 |
| 2026 | 1051.8 | 0 | 1621.4 | 120 | 1100 | 42 |
| 2027 | 0 | 0 | 0 | 1265 | 680 | 0 |
| 2028 | 0 | 0 | 0 | 0 | 0 | 0 |
| 2029 | 0 | 0 | 0 | 0 | 0 | 0 |
| 2030 | 222.8 | 0 | 0 | 0 | 0 | 0 |
ItsNotAboutTheMoney
Well-Known Member
And this is what's going...
There's progressive replacement of steam turbine plants, seemingly replaced by combined cycle or combustion turbine.
| . | Conventional Steam Coal | Natural Gas Fired Combined Cycle | Natural Gas Fired Combustion Turbine | Nuclear | Petroleum Liquids | Natural Gas Steam Turbine | Onshore Wind Turbine | Solar Photovoltaic |
|---|---|---|---|---|---|---|---|---|
| 2022 | 11265.4 | 0 | 286 | 795.8 | 79.8 | 865 | 11.6 | 0 |
| 2023 | 6215.8 | 178.6 | 416.4 | 0 | 458.4 | 4660.3 | 0 | 0 |
| 2024 | 2077.5 | 1422.2 | 126.5 | 1122 | 32.4 | 3230.5 | 0 | 0 |
| 2025 | 5731.9 | 0 | 449 | 1118 | 48 | 2037 | 1.5 | 0 |
| 2026 | 2297 | 227 | 702.3 | 0 | 3.6 | 1790.4 | 0 | 0.8 |
| 2027 | 7061 | 450 | 0 | 0 | 0 | 575 | 0 | 3.8 |
| 2028 | 8057 | 0 | 0 | 0 | 0 | 748 | 0 | 7.9 |
| 2029 | 1923 | 0 | 0 | 0 | 0 | 760.5 | 73.5 | 0 |
| 2030 | 2909 | 0 | 63 | 0 | 0 | 244 | 0 | 0 |
There's progressive replacement of steam turbine plants, seemingly replaced by combined cycle or combustion turbine.
Last edited:
pv magazine USA: Rackless, earth-mounted solar provider earns funding – pv magazine USA. Rackless, earth-mounted solar provider earns funding
Just lay the panels on the ground. Cheap.
Just lay the panels on the ground. Cheap.
Lawrence Berkeley report outlines shifts in demographics of US residential solar adopters
Less affluent households are adopting residential solar but higher incomes found among solar-plus-storage users.
pv-magazine-usa.com
The study showed that the disparity between solar-adopter incomes and the general population has been narrowing over time: Between 2010 and 2020, median solar-adopter incomes in the US fell on an absolute basis from $138k to $115k (see Figure 2, left). The drop reflects the fact that the solar market is deepening, by appealing to less affluent households, and it is broadening into less affluent states. See figure 2, right. which shows an increasing share of the market moving into low- and middle-income states, since 2016.
An online data visualization tool enables users to further explore the data from the report. The authors will host a webinar highlighting key findings from this study on March 17th at 10:00 am Pacific / 1:00 pm Eastern. Register for the webinar here.
dgpcolorado
high altitude member
[rant]Lawrence Berkeley report outlines shifts in demographics of US residential solar adopters
Less affluent households are adopting residential solar but higher incomes found among solar-plus-storage users.
The study showed that the disparity between solar-adopter incomes and the general population has been narrowing over time: Between 2010 and 2020, median solar-adopter incomes in the US fell on an absolute basis from $138k to $115k (see Figure 2, left). The drop reflects the fact that the solar market is deepening, by appealing to less affluent households, and it is broadening into less affluent states. See figure 2, right. which shows an increasing share of the market moving into low- and middle-income states, since 2016.
An online data visualization tool enables users to further explore the data from the report. The authors will host a webinar highlighting key findings from this study on March 17th at 10:00 am Pacific / 1:00 pm Eastern. Register for the webinar here.
I do have to quibble with using income as a proxy for wealth ("affluent"), since the two are not the same. Sort of a pet peeve of mine, although I realize that income is a lot easier to get data on. My income is less than $10k/year and I've had solar for fourteen years, from back when panels weren't remotely cost-effective (payback 30+ years). I make do by being thrifty but am relatively affluent compared to many. Not everyone fits in those neat and tidy income boxes.
[/rant]
Last edited:

Solar-plus-food in ethanol fields could fully power the United States
The conversion of the 40 million acres of ethanol corn farms in the United States into solar-plus-food facilities could generate 1.5 times the nation’s electricity needs, while also powering a 100% electrified passenger vehicle fleet.
 www.pv-magazine.com
Ethanol emits more greenhouse gasses than the gasoline it is supposed to replace. Additionally, ethanol (corn) farms greatly under-utilize land, which is one of the greatest resources in the United States.
Of the 92 million acres of corn planted in the United States every year, roughly 40 million acres (1.6% of the nation’s land) are primarily used to feed cars and raise the octane of gasoline. If this land is repurposed with solar power, it could provide around three and a half times the electricity needs of the United States, which is equivalent to nearly eight times the energy that would be needed to power all of the nation’s passenger vehicles were they electrified.
However, if the nation were to transition this 40 million acres of fuel to solar-plus-food (agrivoltaics), it could still meet 100% of its electricity needs, while also powering a nationwide fleet of electric vehicles.
California’s solar market is now a battery market
A look at the interconnection queue of California’s grid operator shows that the state’s market has already shifted to batteries—sometimes with solar, and sometimes without.
pv-magazine-usa.com
California has long been the nation’s leading market for both battery storage, and “solar plus storage” solutions. But PV Intel’s examination of the interconnection queue from California’s grid operator shows that in terms of large-scale projects, this transformation is reaching another stage. California is on the cusp of no longer being a solar market where batteries are being added—instead, it is becoming a battery market that (sometimes) includes solar.
ItsNotAboutTheMoney
Well-Known Member
I'd say it's a solar+battery market, it's just that there's already a lot of solar to which to add batteries.California’s solar market is now a battery market
A look at the interconnection queue of California’s grid operator shows that the state’s market has already shifted to batteries—sometimes with solar, and sometimes without.
California has long been the nation’s leading market for both battery storage, and “solar plus storage” solutions. But PV Intel’s examination of the interconnection queue from California’s grid operator shows that in terms of large-scale projects, this transformation is reaching another stage. California is on the cusp of no longer being a solar market where batteries are being added—instead, it is becoming a battery market that (sometimes) includes solar.

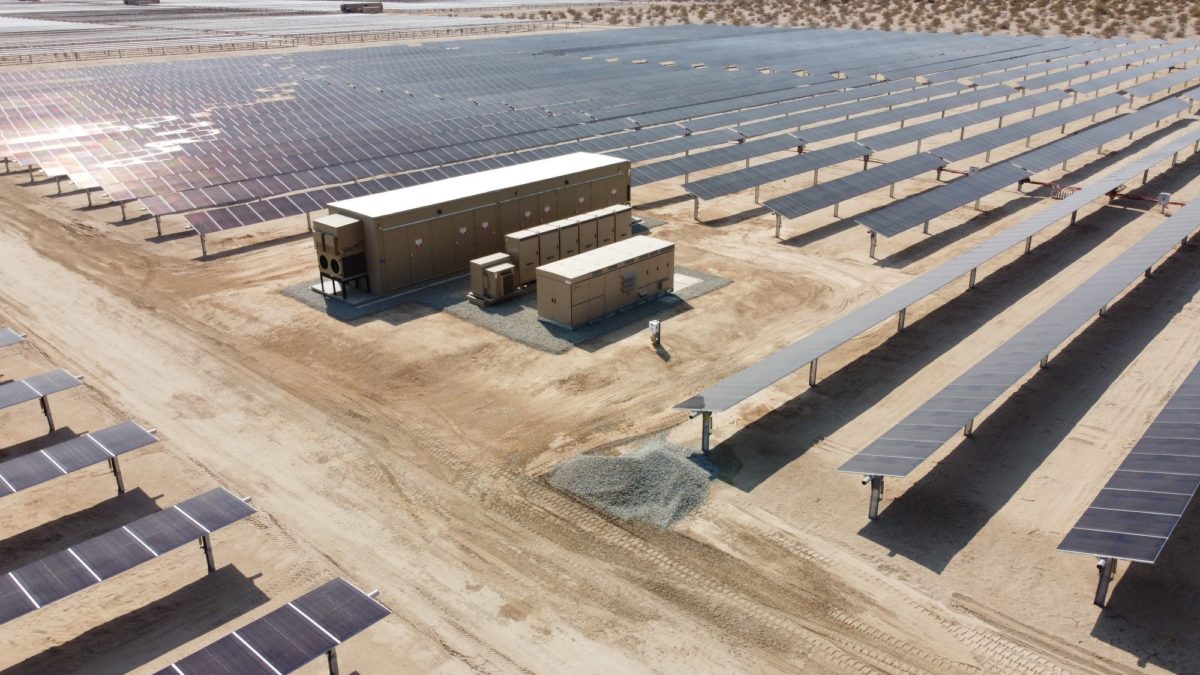
Construction complete for Colorado steel operation’s 300MW solar project
The Bighorn Solar Project has been completed by McCarthy Building in partnership with project owner Lightsource bp.
pv-magazine-usa.com
The project is primarily located on 1,800 acres of Evraz Rocky Mountain Steel property in Pueblo. It is one of the largest on-site solar facilities in the US dedicated to a single customer, with more than 750,000 solar panels. The plant recycles scrap metal to produce new steel products, including railroad track. Kevin Smith, CEO of Lightsource bp, Americas said the project proves that even “hard-to-abate sectors like steel can be decarbonized.”
Similar threads
- Replies
- 1
- Views
- 434
- Replies
- 14
- Views
- 4K
- Replies
- 98
- Views
- 26K
- Replies
- 7K
- Views
- 1M
- Replies
- 19
- Views
- 114K