Welcome to Tesla Motors Club
Discuss Tesla's Model S, Model 3, Model X, Model Y, Cybertruck, Roadster and More.
Register

Solar roof production before PTO vs after PTO

This site may earn commission on affiliate links.
This is from an email last week. "Your solar system does not yet have permission to operate or be fully activated, the solar system will not produce the 11 KW until we receive permission to operate from the utility company."

According to that, they are throttling me and it has nothing to do with sending power back into the grid. They are saying no matter how much electricity I use, that I am artificially capped at some level of production below my max because my system is not "fully activated." And they are saying that this limitation is because I don't have permission from the utility company to produce 11 kW. Is this true or is this BS? (I'm DWP in Los Angeles for anyone wondering.)

Like I said above, my understanding was that the only limitation I have while in self-consumption mode is that I can't export electricity. I didn't think there was any limit to producing as much electricity as I can actually use.
its BS. Your system will self cap if PWs are full. They cannot remotely throttle your production (as far as I know)
Why don't you post some screen shots from the Tesla app so we can see your solar production curve

Edit: I se you had a couple shots in your OP. Take one with the House icon selected
 
  • Like
Reactions: SVDNN
In my experience, Tesla's first tier support presents their impression with much more confidence than it deserves. They will give you something as a "fact" based on their incomplete understanding on how the system works.

It definitely is possible for your peak production to be different before or after PTO if you don't have enough Powerwalls to absorb the peak output, but most likely they are not considering the fact that your system can't get to 11 kW anyway. In many cases the first tier reps don't know any more than you about how solar works.
 
  • Like
Reactions: BGbreeder
This is from an email last week. "Your solar system does not yet have permission to operate or be fully activated, the solar system will not produce the 11 KW until we receive permission to operate from the utility company."

According to that, they are throttling me and it has nothing to do with sending power back into the grid. They are saying no matter how much electricity I use, that I am artificially capped at some level of production below my max because my system is not "fully activated." And they are saying that this limitation is because I don't have permission from the utility company to produce 11 kW. Is this true or is this BS? (I'm DWP in Los Angeles for anyone wondering.)

Like I said above, my understanding was that the only limitation I have while in self-consumption mode is that I can't export electricity. I didn't think there was any limit to producing as much electricity as I can actually use.
To sum, you are not alone in this confusion about peak rates expected from the rated amount of panels (tiles in our case), or even about effect of PTO. There are similar posts just like yours. Moreover, I think your take away from the above comments …. It’s more complicated than what you were explained by the email from Tesla. Unfortunately, you really have to seriously doubt first level customer support responses. Concur with others here, it is simplistic BS answer that will likely “satisfy” most of the Tesla customers so that they just accept it. You will get much more educated responses here regarding these issues. Several factors would play into your second question about whether your peak rate would change after PTO.
To really give you more educated guess on likely production, we would need to see where (compass orientation) your tiles are located, pitch of your roof, shading, cloud effect, ambient temp, time of day and concurrent Powerwalls state of charge, time of year, your location on earth. But just realize…If you are like most others with solar tiles, your tiles are not orientated in one direction only. Therefore, just by that simple fact, you will not get peaks you are expecting, among other reasons as well. Mine is working just fine w- 20.1kW total PV, but my max peak rate at summer solstice occurs around 2pm at 13-14kW with no shading cloudless sky at 75 degrees. Others with same total Pv amount but different house orientation likely will have somewhat different peak and curve shape than I.
Overall, Your goal is to see good area under the ideally bell shaped curve, which equals overall production. Peak is kinda cool thing to think about on the surface but not so meaningful for what you truly want.
And to answer your primary concern, just wait to make final payment to Tesla when PTO approved.
 
  • Like
Reactions: uscpsycho
The raw DC Panel rating will always be higher than the AC output due to how the panels are oriented, inverter sizing and efficiency losses. If your PTO paperwork indicates that you have a 10.0 kW AC rating then that should indicate that your inverter(s) max out that number.

Posted your schematic wire drawing with all of the equipment that was installed should tell the true story.
Sorry, I don't have an electronic version to grab nice screenshots so I attached photos of all the relevant pages.
20220707_112139.jpg20220707_112245.jpg20220707_112438.jpg20220707_112811.jpg20220707_112844.jpg
 
its BS. Your system will self cap if PWs are full. They cannot remotely throttle your production (as far as I know)
Why don't you post some screen shots from the Tesla app so we can see your solar production curve

Edit: I se you had a couple shots in your OP. Take one with the House icon selected
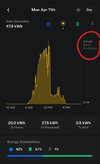
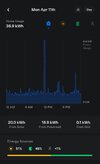
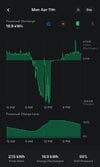
Scrolling through my app history, I found a day where I had 11 KW power production. It is an outlier. What does this circled number mean? I always thought it represented the highest instant peak production number I hit for that day, but now I'm thinking this is the total solar power I produced over the day. And if I have an 11.3 KW system then this is pretty close to hitting that goal, right? Since it happened on some random ordinary spring day, why would production be so much higher than every other day? If I can hit this number once shouldn't it happen with regularity if nothing is wrong?

This is particularly confusing to me because my PW were at 100% for the entire afternoon on this day, which means I wasn't during my max production time, I wasn't producing as much as I could because there was nowhere for excess capacity to go. While in self consumption, I'd expect to produce more power on a day where I have somewhere for all the power to go, not on a day where I'm sitting on fully charged batteries.

Edit: I just checked historical weather and the high on this day was just 67 degrees. And based on the choppy sun curve, it seems like it may have been a cloudy day. Surprised that such a cold (and possibly cloudy) day could produce this kind of power.
Screenshot_20220707-114422_Tesla2.jpgScreenshot_20220707-114408_Tesla.jpgScreenshot_20220707-114433_Tesla.jpg

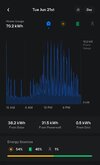
Here is what my stats look like on the summer solstice when it was 89 degrees and based on the smooth sun curve I don't think there were many clouds. My batteries never hit 100% and the day was 92 minutes longer. If I could, you'd think I'd produce a lot more power on this day because there was always somewhere for it to go.
Screenshot_20220707-123830_Tesla.jpgScreenshot_20220707-123842_Tesla.jpgScreenshot_20220707-123852_Tesla.jpg
 
Last edited:
Scrolling through my app history, I found a day where I had 11 KW power production. It is an outlier. What does this circled number mean? I always thought it represented the highest instant peak production number I hit for that day, but now I'm thinking this is the total solar power I produced over the day. And if I have an 11.3 KW system then this is pretty close to hitting that goal, right? Since it happened on some random ordinary spring day, why would production be so much higher than every other day? If I can hit this number once shouldn't it happen with regularity if nothing is wrong?

This is particularly confusing to me because my PW were at 100% for the entire afternoon on this day, which means I wasn't during my max production time, I wasn't producing as much as I could because there was nowhere for excess capacity to go. While in self consumption, I'd expect to produce more power on a day where I have somewhere for all the power to go, not on a day where I'm sitting on fully charged batteries.

Edit: I just checked historical weather and the high on this day was just 67 degrees. I assume there wasn't a cloud in sight but surprised that such a cold day could produce this kind of power.
View attachment 825887View attachment 825888View attachment 825889
The 11kW shows the peak out for at any time of the day. It looks that is right the Powerwalls got filled and the system was idled because the lack of PTO prevented it from shipping the excess to the grid. That means your system is running fantastic! If you had PTO if would have produced a lot more power and dumped a ton of it to the grid. Very impressive for an April day.

Also, I assume the day was cloudy because the jaggedness of the solar graph. If it was this large peak may be do cloud edge effect, when the sun gets very strong as a cloud clears. This gives you artificially high peak numbers.

Also, your solstice graph looks perfect. It is area under the curve not peak numbers you should focus on. Those determine what the kWh daily production.
 
Last edited:
To sum, you are not alone in this confusion about peak rates expected from the rated amount of panels (tiles in our case), or even about effect of PTO. There are similar posts just like yours. Moreover, I think your take away from the above comments …. It’s more complicated than what you were explained by the email from Tesla. Unfortunately, you really have to seriously doubt first level customer support responses. Concur with others here, it is simplistic BS answer that will likely “satisfy” most of the Tesla customers so that they just accept it. You will get much more educated responses here regarding these issues. Several factors would play into your second question about whether your peak rate would change after PTO.
100% true.
To really give you more educated guess on likely production, we would need to see where (compass orientation) your tiles are located, pitch of your roof, shading, cloud effect, ambient temp, time of day and concurrent Powerwalls state of charge, time of year, your location on earth. But just realize…If you are like most others with solar tiles, your tiles are not orientated in one direction only. Therefore, just by that simple fact, you will not get peaks you are expecting, among other reasons as well. Mine is working just fine w- 20.1kW total PV, but my max peak rate at summer solstice occurs around 2pm at 13-14kW with no shading cloudless sky at 75 degrees. Others with same total Pv amount but different house orientation likely will have somewhat different peak and curve shape than I.
I just posted my drawings above. Lucky for me all my tiles are pointing in the same direction and have the same pitch so I have fewer variables than most.
Overall, Your goal is to see good area under the ideally bell shaped curve, which equals overall production. Peak is kinda cool thing to think about on the surface but not so meaningful for what you truly want.
And to answer your primary concern, just wait to make final payment to Tesla when PTO approved.

I passed final inspection and got the OK from the electric company for PTO. But Tesla will not turn on PTO without payment. There is no "final payment" because I'm paying it off in one payment. So once they get paid I lose all leverage.
 
The 11kW shows the peak out for at any time of the day.
The peak out? Not following you, out to where?
It looks that is right the Powerwalls got filled and the system was idled because the lack of PTO prevented it from shipping the excess to the grid. That means your system is running fantastic! If you had PTO if would have produced a lot more power and dumped a ton of it to the grid. Very impressive for an April day.
It does seem impressive, but why is this such an outlier? I added another day's data to the post above, for comparison. Seems like on this second day I should have been able to produce more than I did on the first day because there was nothing stopping me from producing at my full capacity all day.
Also, I assume the day was cloudy because the jaggedness of the solar graph. If it was this large peak may be do cloud edge effect, when the sun gets rvery strong as a cloud clears.
Yep, I realized this after posting and revised my post to say this. Which just makes it all the more confusing why production was so high on this day.
¯\_(ツ)_/¯
 
100% true.

I just posted my drawings above. Lucky for me all my tiles are pointing in the same direction and have the same pitch so I have fewer variables than most.


I passed final inspection and got the OK from the electric company for PTO. But Tesla will not turn on PTO without payment. There is no "final payment" because I'm paying it off in one payment. So once they get paid I lose all leverage.
Welcome to the world of Tesla. They won't file for PTO until paid in full.

Once you do pay, you may need to be diligent about making sure that Tesla does file accurate paperwork in a timely manner, and this is not easy.

Good luck!

BG
 
Sorry, I don't have an electronic version to grab nice screenshots so I attached photos of all the relevant pages.
View attachment 825870View attachment 825871View attachment 825872View attachment 825873View attachment 825874
Ok, so you have 11.376kW of solar panels with a tilt of 18 degrees and an azimuth of 211 degrees and your profile indicates that you are in Los Angeles.

Plugging this information into PVWatts for thin-film panels and the default loss of 14.08% estimates that the system should generate 19,504 kWh annually (check this with the Tesla estimate). Exporting the hourly CSV data shows the highest estimated output is 9.48kW AC and 10.36kW DC, so I would say that your system is operating fully right now.

Looking at the data for 6/21 the peak was estimated to be 9.34kW with 73.5 kWh for the day which is somewhat less than the screenshot that shows 8.9kW peak and 70.2kWh for the day.

Edit: I remembered that you have two PW+ with 7.6kW invertors. This means your DC-to-AC ratio is 11.376:15.2 or 0.75 and the PVwatt default is 1.2. Changing this in the advanced settings decreases slight to 19,440 kWh/year, but also increases the max AC to 9.97kW AC and the DC remains the same at 10.36kW. The data on 6/21 increase the peak to 9.36kW, but decreases the day to 73.4 kWh. These differences in the AC output are due to the efficiency curve of the invertor which is more efficient as it nears it's rated max and less efficient at the lower input levels which is most of the day for your configuration.

Edit 2: The PVwatts calculator is built for traditional solar panels and there are probably some differences/losses with the solar roof modeling.
 
Last edited:
The peak out? Not following you, out to where?
Sorry Peak output. The one-time highest instantaneous amount the solar Power in kW.
It does seem impressive, but why is this such an outlier? I added another day's data to the post above, for comparison. Seems like on this second day I should have been able to produce more than I did on the first day because there was nothing stopping me from producing at my full capacity all day.

If by second day, you mean June 21, then you did produce more Energy (kWh) on June 21, 70.2 kWh versus April 11 with 47.9 kWh. Don't focus on peak Power (kW) output on the right on your solar graph. Look at the Energy (kWh) produced over the day on the left. This is the energy that powers your home, gets you credits on your bill, what you buy from the electric company, etc.
 
Last edited:
Scrolling through my app history, I found a day where I had 11 KW power production. It is an outlier. What does this circled number mean? I always thought it represented the highest instant peak production number I hit for that day, but now I'm thinking this is the total solar power I produced over the day. And if I have an 11.3 KW system then this is pretty close to hitting that goal, right? Since it happened on some random ordinary spring day, why would production be so much higher than every other day? If I can hit this number once shouldn't it happen with regularity if nothing is wrong?
The spike to 11kW is an cloud edge effect and it is a momentary surge as the cloud edge acts as a lens.
 
As Redhill_qik has said, your system looks like it is performing to expectation. Just to confirm, I ran your parameters into a different solar estimator, and it gave 9kW at peak and 73kWh for June 21. The Tesla SR72T2 roof tile that is listed on your drawing has a temperature coefficient for power of -0.372%/C, similar to typical solar panels. The 11.3kW rating assumes that the roof temperature is 25C and is receiving 1000W/m^2 solar insolation. But your tiles are hotter than that this time of year, and the 211 degree azimuth is 31 degrees away from optimal. The actual roof temperature in full sun on June 21 is at least 20C higher and I guess more like 30C higher. 30C times 0.372 implies a power reduction of 11% compared to what you might see on a March or April cloudless day. The program I used projects that in mid-April you may see slightly more daily production than in June, if it is a cloudless and cool day, even though there are fewer hours of sunlight.

Just to be clear, with solar power higher temperatures decrease production, because the efficiency of photoelectric generation is decreased. The actual temperature that matters is the tile or panel temperature, although that tends to follow air temperature.
 
  • Informative
Reactions: Redhill_qik
Welcome to the world of Tesla. They won't file for PTO until paid in full.

Once you do pay, you may need to be diligent about making sure that Tesla does file accurate paperwork in a timely manner, and this is not easy.

Good luck!

BG
Not sure if I'll have any success, but before I pay I'm going to try to get them to commit to some amount of time by which they will file the PTO paperwork. Any insight as to how long is reasonable? And then how I can confirm when it was actually filed?

Ok, so you have 11.376kW of solar panels with a tilt of 18 degrees and an azimuth of 211 degrees and your profile indicates that you are in Los Angeles.

Plugging this information into PVWatts for thin-film panels and the default loss of 14.08% estimates that the system should generate 19,504 kWh annually (check this with the Tesla estimate). Exporting the hourly CSV data shows the highest estimated output is 9.48kW AC and 10.36kW DC, so I would say that your system is operating fully right now.

Looking at the data for 6/21 the peak was estimated to be 9.34kW with 73.5 kWh for the day which is somewhat less than the screenshot that shows 8.9kW peak and 70.2kWh for the day.

Edit: I remembered that you have two PW+ with 7.6kW invertors. This means your DC-to-AC ratio is 11.376:15.2 or 0.75 and the PVwatt default is 1.2. Changing this in the advanced settings decreases slight to 19,440 kWh/year, but also increases the max AC to 9.97kW AC and the DC remains the same at 10.36kW. The data on 6/21 increase the peak to 9.36kW, but decreases the day to 73.4 kWh. These differences in the AC output are due to the efficiency curve of the invertor which is more efficient as it nears it's rated max and less efficient at the lower input levels which is most of the day for your configuration.

Edit 2: The PVwatts calculator is built for traditional solar panels and there are probably some differences/losses with the solar roof modeling.
As Redhill_qik has said, your system looks like it is performing to expectation. Just to confirm, I ran your parameters into a different solar estimator, and it gave 9kW at peak and 73kWh for June 21. The Tesla SR72T2 roof tile that is listed on your drawing has a temperature coefficient for power of -0.372%/C, similar to typical solar panels. The 11.3kW rating assumes that the roof temperature is 25C and is receiving 1000W/m^2 solar insolation. But your tiles are hotter than that this time of year, and the 211 degree azimuth is 31 degrees away from optimal. The actual roof temperature in full sun on June 21 is at least 20C higher and I guess more like 30C higher. 30C times 0.372 implies a power reduction of 11% compared to what you might see on a March or April cloudless day. The program I used projects that in mid-April you may see slightly more daily production than in June, if it is a cloudless and cool day, even though there are fewer hours of sunlight.

Just to be clear, with solar power higher temperatures decrease production, because the efficiency of photoelectric generation is decreased. The actual temperature that matters is the tile or panel temperature, although that tends to follow air temperature.
Can't thank you both enough for digging into this, but I'd be lying if I said I understood everything you just explained. For someone who is highly educated and technically sophisticated, trying to understand all of this is both frustrating and humbling. While some of the technical stuff is going over my head, it sounds like everything is working as it should. So if this was your system you wouldn't have any concerns about performance?

Sorry Peak output. The one-time highest instantaneous amount the solar Power in kW.


If by second day, you mean June 21, then you did produce more Energy (kWh) on June 21, 70.2 kWh versus April 11 with 47.9 kWh. Don't focus on peak Power (kW) output on the right on your solar graph. Look at the Energy (kWh) produced over the day on the left. This is the energy that powers your home, gets you credits on your bill, what you buy from the electric company, etc.
OK, that is what I originally thought, that this number was the highest daily instantaneous peak. But after hearing about how pointless that number is, I assumed it must mean something else. Especially since it is labeled "power production" rather than "peak power production."

So then how do I figure out what my kW production is for any given day? My system is rated for 11.3 kW but the Tesla app only shows solar production in kWh delivered to home/pw/grid. From this data I get in the app, how do I know how close I came to 11.3 kW on any given day? Please use the 4/11 or 6/21 data as examples.
 
OK, that is what I originally thought, that this number was the highest daily instantaneous peak. But after hearing about how pointless that number is, I assumed it must mean something else. Especially since it is labeled "power production" rather than "peak power production."
I think this because it’s actually just the legend at the top of the y axis. The bottom is labeled 0 kW and the top corresponds to the highest graphed value because the axis adjusts to fit the chart.
 
  • Like
Reactions: uscpsycho
So then how do I figure out what my kW production is for any given day? My system is rated for 11.3 kW but the Tesla app only shows solar production in kWh delivered to home/pw/grid. From this data I get in the app, how do I know how close I came to 11.3 kW on any given day? Please use the 4/11 or 6/21 data as examples.
First definitions, kW is power (current * voltage) and kWh is work (kW * time). The Tesla app shows you both kW (the curve) and kWh (the area under the curve). If you press on the graph it will bring up a slider and you can see the kW for any time as you slide left and right.

1657242662472.png


Second your system is not rated for 11.3 kW, put your solar roof panels have a 11.376 kW specification which is realized under ideal conditions (solar flux, angle, and temperature) and it has losses due to resistance in the connecting wires and the efficiency of the DC-to-AC conversion. As I wrote early using the information that you have provided with the PVwatts estimation tool the best that your solar panels will generate is 10.36 kW due to the tilt (18 degrees), the azimuth (211 degrees vs 180 degrees due south) and your geo location. Assuming an average system loss of 14% and with two 7.6kW invertors resulting in a DC-to-AC ratio of 0.75 (typically target is 1.2) gets you to an estimated maximum of 9.97 kW (a couple of days a year for an hour) with an annual production of 19,440 kWh.

Due to cloud edge effects causing lensing, you may and have seen spikes that exceed estimate max, but those last for tens of seconds and are not really relevant. Track the kWh per day and per year, because this is what is offsetting your electric bill.
 
Assuming an average system loss of 14% and with two 7.6kW invertors resulting in a DC-to-AC ratio of 0.75 (typically target is 1.2) gets you to an estimated maximum of 9.97 kW (a couple of days a year for an hour) with an annual production of 19,440 kWh.
I think I'm getting the gist of all this so I hope these are my last noob questions.

When trying to compare the actual performance of my system to the expected performance of my system, neither the rated 11.3 kW nor expected 9.97 kW are useful numbers because those only represent instantaneous peak production numbers. And I now understand that's not very useful information plus it can be inaccurate due to lensing. Correct?

So the only way to really evaluate system performance is to compare actual production on any given day with whatever a solar production estimation tool predicts for that day. I can't just look at the app to know. Correct?

And until I have PTO, the only way to know how much I power my system can generate would be on a cloudless day, that doesn't get too hot and my production isn't idled by my batteries hitting 100%. I don't see that happening because the only time I don't hit 100% is on the hottest days when my AC is running like mad. So then after PTO I will know how exactly how much I am generating because there will be no idle time and then I can compare that with a solar power estimator. Correct?
 
Can't thank you both enough for digging into this, but I'd be lying if I said I understood everything you just explained. For someone who is highly educated and technically sophisticated, trying to understand all of this is both frustrating and humbling. While some of the technical stuff is going over my head, it sounds like everything is working as it should. So if this was your system you wouldn't have any concerns about performance?

No worries...I am sure you will learn this all in time and the some. Sad thing is that your knowledge base in solar right now probably exceeds the average Tesla solar employee. This forum and many contributors are an excellent resource...use the search function and peruse the other inquiries, they cover many of your questions and even those that you never knew you wanted to know about.

All your tiles in pointing in ideal direction (SW). So as long as you do not have shading issues during certain times of day (eg., trees, buildings, hills), you have an ideal setup.

As people have chimed in, your peak production looks fine. Most likely, your total production will be fine once PTO allows you to push your excess production (ie., energy produced when your power walls are full) to the grid for energy credits.
I would recommend you proceed to payment and PTO. If you feel there are issues after PTO, bring it up here for input. If you need to deal with Tesla after PTO, they are responsive with some persistent calling.

At this point, the worst is over in this process. Set back, and enjoy the "free" energy :cool:
 
  • Like
Reactions: uscpsycho