At the time of my last post over the weekend I wasn't too worried about it yet because we were still green on the month, however that was before the GS downgrade. Despite the nice move today, we ended up still closing the month negative, which is very worrisome. In fact, I described this exact scenario as something to watch out for:
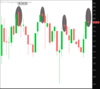
As it turns out, the move wasn't over, as expected, going from $250 to $280. However, we did form the reversal candle the next month as I feared. Here's what it looks like:
View attachment 216770
That is self explanatory how worrisome it is. I'd qualify this by saying, the reversal can still be negated with price breaking above $260, and confirmed below $240.
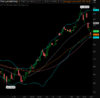
There are some glimmers of hope on smaller timeframes, as we are approaching a confluence of supports, probably explaining today's strength:
View attachment 216787
On the daily chart we have the 50 EMA(orange), 50 SMA(pink), lower bollinger bands and 38.2% Fib retracement all converging at where price has held. In addition, $242 has been a price of significance going back two years:
View attachment 216779
It has acted as either support or resistance basically every time price has gotten there since late 2015. I don't think it is a coincidence that $242 was the price of the cap raise that year.
So we really have a fortress of supports all lining up at the same spot. IF we can hold here in the coming days and rally back up to above $260, it would go well with what I talked about over the weekend, continuing the analog from 2013, consistent with how price has behaved the past two cap raises. Not to mention it would negate the ugly looking monthly top.
But that is a big IF. Like I've talked about before, I put a lot more weight in what's going on in larger timeframes than the smaller ones. A topping candle on the monthly is a big red flag, and has me feeling cautious at best.


") . I'm thinking about raising my LC amount to a higher value but want to see how the notes I bought since September do and how TSLA does. Problem with this is that you almost need to see the how the notes perform from start to finish (3-5 years) to get a good idea of your actual returns. However, after about 1 year I think you can have a good idea if they're going to perform better than CDs or not. Almost all the defaults I'm getting right now are notes I bought back in 2013-2014. My original thought process was all the bad apples would default early and who in the world would default when you've already paid off almost all of the loan? I have no idea. AustinEV probably knows a lot more about how it all works so sorry I don't have great advice about LC.
. I'm thinking about raising my LC amount to a higher value but want to see how the notes I bought since September do and how TSLA does. Problem with this is that you almost need to see the how the notes perform from start to finish (3-5 years) to get a good idea of your actual returns. However, after about 1 year I think you can have a good idea if they're going to perform better than CDs or not. Almost all the defaults I'm getting right now are notes I bought back in 2013-2014. My original thought process was all the bad apples would default early and who in the world would default when you've already paid off almost all of the loan? I have no idea. AustinEV probably knows a lot more about how it all works so sorry I don't have great advice about LC.