Welcome to Tesla Motors Club
Discuss Tesla's Model S, Model 3, Model X, Model Y, Cybertruck, Roadster and More.
Register

Tesla market share of BEVs in NSW

This site may earn commission on affiliate links.
Even your basic Nokia was a lot more than $150 in the day, and combined with say a $500 Palm Pilot, or a BlackBerry, the iPhone wasn't actually that expensive. And compared to your original $2k+ car phones, they were cheap.

Now yes they've expanded the market for those willing to buy premium communication devices, but equally Tesla has done that for premium sedans.

But particularly in Australia due to geography, you've got a practical limit in that car format.
 
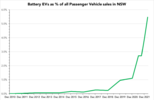
The RMS statistics for Q1 2022 came out today - BEVs set a new record of nearly 5.5% of all passenger vehicle sales in NSW!

Over 1500 Teslas and nearly 2300 BEV passenger vehicles registered in a quarter are new records by a considerable margin. In fact Tesla delivered more cars in Q1 in NSW than it did in its first 5 full years here.

NSW Battery EV statistics for Q1, 2022​

BEV fleet statistics​

(and change from previous quarter)
Total BEVs (all vehicles): 14183 (+2354 or 19.9%)
Total BEV passenger vehicles: 12688 (+2296 or 22.1%)

Tesla statistics​

(and change from previous quarter)
Total Teslas: 8758 (+1521 or 21.0%)
Total non-Tesla BEVs: 5425 (+833 or 18.1%)
Tesla market share of BEV fleet: 61.7%
Tesla market share of BEV passenger vehicles: 69.0%
Tesla incremental market share for this quarter: 64.6%

BEVs as percentage of all new passenger vehicle registrations​

5.46%​


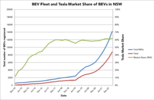
And here's the charts...

tesla.png

bev.png
 
I'll just add that at the current rate of growth (doubling every year), the $3k ZEV rebate pool of 25,000 vehicles would be exhausted by the end of June next year and NSW would hit 30% of all new vehicles sold being BEVs by the end of 2024 - two and a half years ahead of the mid 2027 backstop date.

At that point, the RUC will kick in and stamp duty removed from all zero-emissions vehicles in NSW.
 
Doubling won't happen. Q2 Tesla deliveries will be <100 for NSW though hopefully they catch-up with near 3000 in Q3 - but they are effectively capping Aus production per quarter.

BYD might start adding decent numbers as they have an allocation of 1500 vehicles for Australia a month.

The rest will remain small.
 
Doubling won't happen. Q2 Tesla deliveries will be <100 for NSW though hopefully they catch-up with near 3000 in Q3 - but they are effectively capping Aus production per quarter.

The 100% CAGR (actually 101%) is the trend over the past 5 years so I’m not just looking at the past 6 or 12 months. But I agree lack of Q2 supply could be a real problem for BEV sales - we’ll find out in about 3 months.
 
  • Like
Reactions: Hairyman
The RMS statistics for NSW came out this morning and show the cratering of Tesla vehicle supply due to the Shanghai factory shutdown through most of Q2. Only 35 registered in the quarter!

And because Tesla has such dominance of the BEV market here, the percentage of new vehicles registered that were BEV is way down to under 2%. But it‘s a brief moment in the sun for the others, with a record number of deliveries in Q2 (930), grabbing 96% of all BEV sales.

Charts to come later today. And Q3 will of course show a very different picture with Model Y arriving. Always something to look forward to :)

NSW Battery EV statistics for Q2, 2022​

BEV fleet statistics​

(and change from previous quarter)
Total BEVs (all vehicles): 15148 (+965 or 6.8%)
Total BEV passenger vehicles: 13540 (+852 or 6.7%)

Tesla statistics​

(and change from previous quarter)
Total Teslas: 8793 (+35 or 0.4%)
Total non-Tesla BEVs: 6355 (+930 or 17.1%)
Tesla market share of BEV fleet: 58.0%
Tesla market share of BEV passenger vehicles: 64.9%
Tesla incremental market share for this quarter: 3.6%

BEVs as percentage of all new passenger vehicle registrations​

1.91%​

 
I’ll need to rethink this thread as the NSW Department of Transport has gone all modern and dashboardy and now has monthly registration data in close to real-time on their reporting portal. Basically making this whole thread redundant:

Registration snapshot report | Transport for NSW

You need to go down to the Microsoft Power BI toolbar towards the bottom and click the arrow to go to page “2 of 2” to get past the explanatory slide.

There you will find a quite nice dashboard in which you can slice and dice the data in multiple ways.

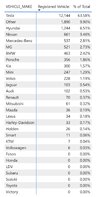
For example, we can find out that 15,422 battery electric vehicles were registered in NSW at the end of July, of which 8801 were Teslas, increasing to 16,909 BEVs (10,394 Teslas) at the end of August, and 19,100 BEVs (12,144 Teslas - of which 5747 are white 😄) at the end of September.

You can also slice by LGA, and find out how many EVs are in your local government area.

So that’s a 26% increase in the number of BEVs in just 3 months, and a 38% increase in the number of Teslas, since my Q2 report above.

NSW is the first state with more than 10,000 Teslas registered 👏

Hyundai has the second biggest BEV fleet, with 1244 vehicles. A very distant second.

Now they just need an API to this portal 🤣 and I could automate the derivation of other stats, like market share and fleet share of EVs.
 
Last edited:
Hmmm!!, no Polestar. They must be registered as Volvo?

Possibly, or they are buried under “Other” which is not very helpful. I’d like to see BYD’s count too. If you click and hold a tile in that manufacturer infographic, you have the option of displaying the data as a table which reveals this. Still no Polestar listed though.

FB3B9C99-C9AC-4724-8C3A-910E859E1E5F.jpeg

Those 26 Holden BEVs probably aren’t, and they are the plug-in Volts.
 
This thread largely became redundant with NSW deploying its fancy-pants PowerBI registration dashboard in 2022, and also @Aryll's impressive stats dump on the Australian BEV sales data thread.

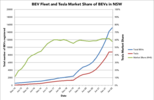
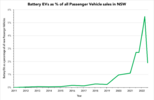
However, I have made my first update to the NSW chart in 18 months, because one thing the NSW dashboard does not provide is a view of registrations over time. Also I have now backdated the chart to 2010.

Key stats:
  • There are now 55,360 BEVs registered in NSW
  • There are now 31,421 Teslas registered in NSW, giving Tesla a fleet market share of 56.8%. January's figure of 56.1% market share was the lowest it has ever been since June 2017.
  • Despite that, Tesla's market share has remained solidly in the 55%-64% range for nearly 7 years straight. Only in recent months has there been any sign that increasing competition in the BEV space might finally be starting to have a sustained impact on Tesla's market share.
  • 3337 BEVs were added to the NSW fleet in February - an all-time record. Previous record was 3064 in September last year.

NSW.png


The chart below is the same as the one above, except the number of BEVs registered is shown on a logarithmic scale. Exponential growth is a straight line on a log scale.

And you can clearly see two distinct exponential growth periods - 2010 to mid 2019 (compounding annual growth rate of 37.2% per annum) and a much faster growth period from mid 2019 to today, following the release of the Model 3, where it increased two-and-a-half times to a rather amazing compounding annual growth rate of 91.9% per annum.

NSWlog.png


If that growth rate continues, NSW would pass the 100,000 BEV mark early next year.

NSW is also within touching distance of being the first state to have 1% of its entire vehicle fleet battery electric. Taking out trailers (which have no motive power and represent 14.7% of all registrations) that milestone should be reached in June.

Now that might not sound like much (and it kinda isn't) but it is really, really hard to change out an entire vehicle fleet and it takes a very long time to do it. For 1 in every 100 vehicles on the road to be BEV would, I think, still be a very significant moment!
 
Now that might not sound like much (and it kinda isn't) but it is really, really hard to change out an entire vehicle fleet and it takes a very long time to do it. For 1 in every 100 vehicles on the road to be BEV would, I think, still be a very significant moment!
The average age of a passenger vehicle in Australia is 10 years. How many BEVs were there in Australia 10 years ago?
 
The average age of a passenger vehicle in Australia is 10 years. How many BEVs were there in Australia 10 years ago?

Well I don’t know the exact answer to that, but in NSW, on 1/1/14, there were 446 BEVs registered. That would have been a mix of Nissan Leafs, Mitsubishi i-Mievs, and private conversions. Tesla did not deliver its first vehicles here until December that year.

NSW is about 1/3rd of Australia’s pop, so that implies about 1400 nationally ten years ago.
 
  • Like
Reactions: moa999
Well I don’t know the exact answer to that, but in NSW, on 1/1/14, there were 446 BEVs registered. That would have been a mix of Nissan Leafs, Mitsubishi i-Mievs, and private conversions. Tesla did not deliver its first vehicles here until December that year.

NSW is about 1/3rd of Australia’s pop, so that implies about 1400 nationally ten years ago.
That is actually surprisingly high number for me :) What are those private conversions?
 
That is actually surprisingly high number for me :) What are those private conversions?

That’s where people take ICE vehicles, rip the out the engine, transmission and petrol tank, and put in an electric motor, batteries and associated electronics.

I went to a Nissan LEAF meet-up about 6 years ago (yes, there used to be such things) on the roof of the Westfield Chatswood car park, and 2 people there had cars they had converted themselves to be electric. Clearly they had skills far, far superior to mine.

I couldn’t tell you what kind of cars they were, I’m not a car nut, one was a sports car (two door, low slung). The other looked like a 70s sedan.

There are also some companies out there that do conversions to EV, but they’re typically not widely known.
 
Only in recent months has there been any sign that increasing competition in the BEV space might finally be starting to have a sustained impact on Tesla's market share.

Tesla had a first mover advantage but competition is a good thing
We used to see tiresome debates about Fords vs Holdens, Currently it is more or less similar with Tesla vs the rest.
The great thing about the demise of Ford vs Holden is the explosion in choice. I look forward to great EV choice

It will be very interesting to also note the average age of an EV in Australia over time and when it starts to plateau. We are nowhere near replacement age for EV's yet.
 
  • Like
Reactions: kmsyd777