Welcome to Tesla Motors Club
Discuss Tesla's Model S, Model 3, Model X, Model Y, Cybertruck, Roadster and More.
Register

Tesla market share of BEVs in NSW

This site may earn commission on affiliate links.
NSW RMS was very slow getting the stats out for Q3... so much so that I emailed them on Monday asking what was going on. Whether that was the trigger I'll never know, but the Q3 stats have been finally published! And what an interesting quarter it was!

You will not be surprised to learn that in Q3 NSW saw a record number of BEVs registered - a total of 904 new BEVs landed on our roads, more than quadrupling the previous record of 198, set Jan-Mar 2018. But what I found even more interesting was that Tesla did not have it all their own way.

Tesla did of course also set a new record - adding 593 vehicles to NSW roads, smashing their previous record of 142 set in Q2 2017. There are now 1931 Teslas on NSW roads. But the number of non-Tesla BEVs added is also a record: 311, triple the previous record of 105 set only last quarter.

So Tesla's incremental market share this quarter was an impressive 65% but in the past Tesla had virtually no competition and regularly represented more than 80% of all new BEV registrations in a quarter. Tesla's fleet market share has now bounced up to 58.1% but that's still short of their record 60.3% set a year ago.

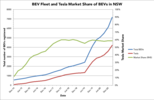
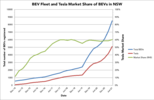
At the end of Q3, NSW had a total of 3322 BEVs on the road. Here's the updated chart with a brand-new Y-axis to cope:

tesla.png

The next quarter will also be fascinating, as it will be the first complete quarter with sustained Model 3 deliveries. Expect records to be broken again!
 
Last edited:
RMS stats for the final quarter of 2019 are out - and besides records being broken again, what I find particularly interesting is the sustained increase in non-Tesla BEVs.

At the end of 2019 the 4000-barrier has been cracked, with 4131 BEVs now registered in NSW. The number of BEVs on NSW roads nearly doubled in 1 year (91.3% increase).

Tesla added 531 cars to the fleet (not quite as many as the 593 in the quarter prior) while 278 non-Tesla BEVs were added (second highest on record). Tesla is now just short of 2500 cars on NSW roads (2462). Tesla's incremental market share was unchanged from the previous quarter at 65.6% but fleet market share has grown slightly to 59.6%, the second highest Tesla has ever achieved.

Here's the updated chart, with yet another increase in the Y-axis to cope :D

tesla.png

And in my regular dig at HFCEVs, they have dropped to 59, the lowest ever since online RMS records began in 2000.
 
  • Informative
Reactions: baillies
I wonder what the stats are for Vic? Feels like there are way more Tesla’s than that!
Good question, because VIC, like all the other states (except NSW), does not publish vehicle registration statistics online on a regular basis. Perhaps you should petition VicRoads to open up the data files.

Registration data is the only data which can be trusted because it is not dependent upon the voluntary submission of data from the manufacturers themselves, and it captures both additions to the fleet and exits from the fleet (write offs, interstate transfers etc) not just sales. Also Tesla does not contribute any data and is not a member of the FCAI, so the only way its sales are exposed is through rego data.

The only bits of information required for me to do my analyses are:
  • Total number of BEVs registered in the state (it is important these are split out from other types of plug-ins, and not all data sets do it)
  • Total number of Teslas registered in the state (we only need to know the manufacturer, because all Teslas are BEVs)
  • Change since the previous quarter (which can be inferred if the above data is published quarterly)
NSW RMS provides statistics which has these parameters online for free. In that sense, it is way ahead of the other jurisdictions here. But in global terms, it is not that impressive. For example, NZ provides full statistics monthly, and Netherlands provides them in real time. THAT is impressive.
 
  • Informative
Reactions: Chuq
It’s such a wet Saturday morning here in Sydney that I’ve trawled the web for every roads/transport authority in Australia to see what they’ve got. Answer: not much.

The only relevant information I’ve been able to find in other jurisdictions are:
  • QLD: publishes brief data annually. This reveals there were 988 pure electric passenger vehicles registered in QLD at the end of June 2019. But no information on how many of those are Teslas.
  • ACT: publishes very detailed information annually. But it’s too detailed, there are no summary tables for example that report the total number vehicles by motive power. It could be deduced if you went through the entire list of 50,160 vehicles by make and model to pull out the BEVs, but I’m not gonna do that. So the only useful data that came out was that there were 54 Teslas registered in the ACT at the end of June 2019.
And that, my friends, is the sum total of easily accessible and recent data on the state of Tesla/BEV across the country.
Have a look at Vehicle registrations - Open Data Portal | Queensland Government for Queensland.
 
RMS stats for the first quarter of 2020 are out. Not surprisingly, Tesla did not deliver as many cars in NSW in this quarter as in the previous two quarters, but still more than in any quarter prior to Model 3. The last 3 quarters for Tesla now read 593, 531 and 377.

The increase in non-Tesla BEVs also continues to be sustained, with another 296 being added (second highest on record) which is great news since Tesla can't achieve the mission all by itself. So Tesla's market share seems to have hit a ceiling at around 60%.

NSW is approaching 5000 BEVs (4804) but this figure includes all electric vehicles including motorcycles, vans and trucks. I have retained expressing Tesla market share as a percent of all BEVs (not just passenger vehicles) to save me having to redefine things when Tesla starts delivering Cybertruck and other vehicle types in the future. Keep it simple.

Tesla now has 2839 cars on NSW roads.

tesla.png
 
RMS stats for the second quarter of 2020 are out. Not surprisingly, the number of new BEVs is down substantially due to Covid-19. But still, 281 BEVs were added in the quarter, which is still more than any quarter prior to the arrival of Model 3.

BEV growth in FY20 was 110% (i.e. more than double), the highest ever increase in 1 year. Tesla growth in the same period was 123%.

Significant points:
  • For the first time NSW now has over 5000 BEVs in the fleet
  • Tesla is just shy of 3000 cars in NSW (2979)
  • Non-Tesla BEVs still impress, with 141 non-Tesla BEVs added to Tesla's 140.
Here's the chart.

tesla.png
 
Very belatedly, here are the stats for NSW for the third quarter of 2020. The stats came out in early December but I dropped the ball :p

426 BEVs added, of which 224 were Teslas. Tesla's overall BEV market share down a little to 58.1%. 5511 BEVs now in NSW and 3203 Teslas.

Tesla.png
 
The stats for NSW for the final quarter of 2020, A big one for Tesla, with 400 vehicles registered - the highest number since the same quarter the previous year.

There are now 3603 Teslas in NSW, and 6135 BEVs. 48.5% growth in BEVs in calendar 2020, compared to 91.1% in 2019 thanks to the arrival of Model 3.

tesla.png
 
  • Like
Reactions: mike_j
The RMS stats for Q1 were finally released today (a bit late chaps...) but an interesting and record-breaking quarter in NSW.

For the first time ever, over 1000 BEVs were added to the fleet in one quarter (1030 to be exact) of which 603 were Teslas. NSW now has 7165 BEVs on the road and 4206 Teslas.

Tesla's market share seems to be stuck in a very narrow range at 58-59% and has barely moved since September 2019. Which I guess is a good thing, because it means other BEVs are being sold in similar proportions (427 non-Tesla last quarter - also a record).

With reportedly another 1500 Teslas landing in just one shipment last week, Q2 this year could be even bigger!

Here's the updated chart, with Y-axis increased again to keep up 😀

tesla.png
 
The RMS stats for Q2 were finally released yesterday for another record-breaking quarter in NSW:
  • 1333 BEVs added to the fleet - a record
  • 904 Teslas added to the fleet - a record
  • 429 non-Teslas added to the fleet - a record
NSW now has 8498 BEVs on the road and 5110 Teslas. Tesla is now adding as many cars per quarter in NSW as it did in total in its first 3 years.

Here's the updated chart, with Y-axis increased again to keep up

tesla.png
 
The RMS stats for Q2 were finally released yesterday for another record-breaking quarter in NSW:
  • 1333 BEVs added to the fleet - a record
  • 904 Teslas added to the fleet - a record
  • 429 non-Teslas added to the fleet - a record
NSW now has 8498 BEVs on the road and 5110 Teslas. Tesla is now adding as many cars per quarter in NSW as it did in total in its first 3 years.
What is the percentage of EV's to total cars/vehicles sales for the quarter?.