


Part 3 of my three-year review covers: Energy Use and Carbon Emissions from driving 42,500 miles in our Model 3. Links to Parts 1-4 of the review are at the bottom.
We drove 42,500 miles in the first three years. I calculated how many kWh of electricity were sent to my car to charge the battery pack, and from that I estimated carbon emissions from producing the electricity.
I don’t have a separate meter to record energy use by my home charging station so I started with the amount of energy that the car reported using, and worked back from there. I took into account charging inefficiencies and estimated energy use by BMS and Sentry Mode – the UI currently reports energy use while driving. This is a back of the envelope estimate so keep in mind that YMMV.
Energy Use
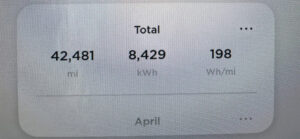
11,100 kWh of electricity were used to charge my car over 3 years.
Here’s how I came up with that number: My car reported using 8429 kWh from the battery pack while driving. After taking into account efficiency of home Level 2 charging (I assume 85%), how many kWh I got from Superchargers (1428), and efficiency of Supercharging (I assume 92%), we get to 9789 kWh. I estimate an additional 1 kWh per day for BMS and Sentry Mode (+ 85% efficiency) = 1290 kWh. That totals 11,079 kWh – rounding up to 11,100 kWh. So 11,100 kWh to drive 42,500 miles. This gives us an efficiency from the wall of about:
3.8 miles per kWh261 Wh per mile16 kWh per 100 km.
Emissions
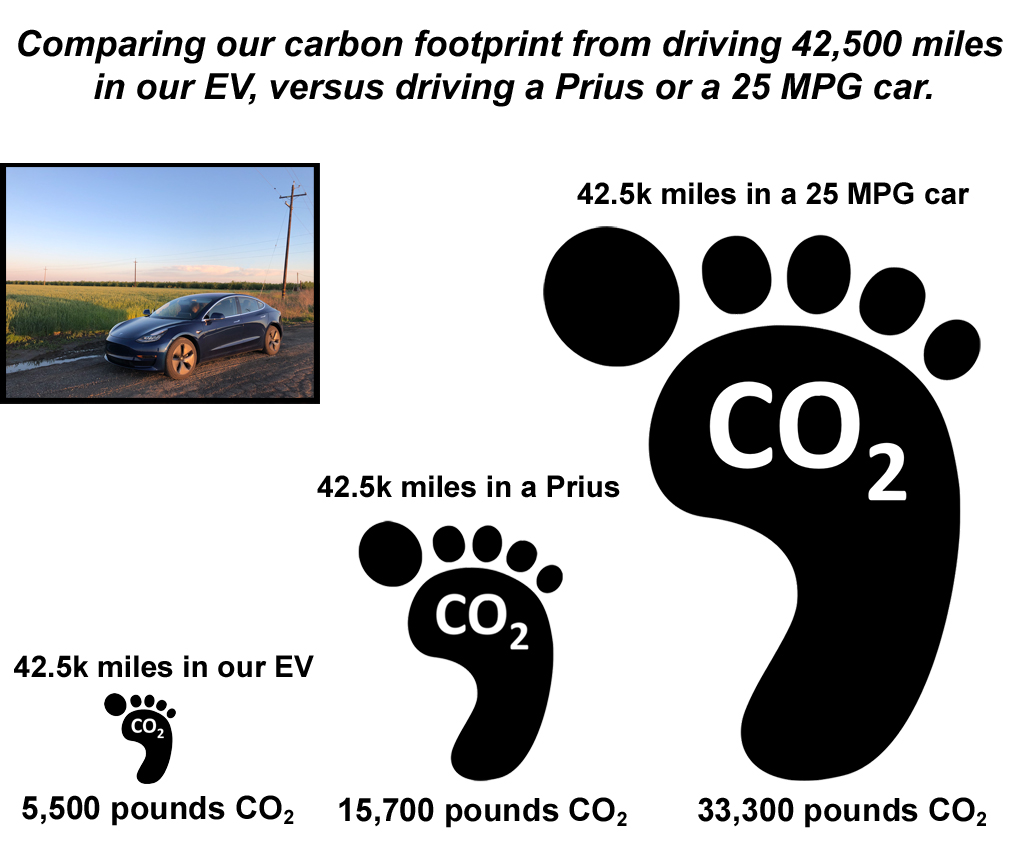
I estimate that our carbon emissions from three years of driving the Model 3 were 5,445 lbs of CO2 (See Methods and spread sheet at bottom for details). That’s just 17% of the emissions from driving the same distance in a 25 MPG car, and 34% of the emissions from a 2010 Prius. Driving an electric car produced an immediate and large reduction in our carbon footprint.
Comparing Gas and Electric Vehicles
There are two ways I compare the efficiency of gas and electric cars. One considers the kWh energy equivalent in a gallon of gas to compare the energy required to drive XX miles in gas-powered or electric cars. The second way is to compare emissions from driving electric versus gas.
Energy Equivalent Comparison: How does using 11,100 kWh to drive 42,500 miles compare to how much gasoline we would have used? One gallon of gas has the equivalent energy of 33.7 kWh of electricity. Using this approach, 11,100 kWh of electricity is the equivalent to the energy in 330 gallons of gas (11,100 kWh ÷ 33.7 kWh/gallon = 330 gallons). So 330 gallons of gas to drive 42,500 miles is like driving a car that gets 128 MPG. Electric cars are much more efficient than gas-powered cars and the reasons are straightforward: a lot of the energy released by burning gas is lost to heat and that sizable heat loss doesn’t happen with electric motors. Case in point: check out the snow on the hood of my electric car after driving 120 miles through a snow storm.
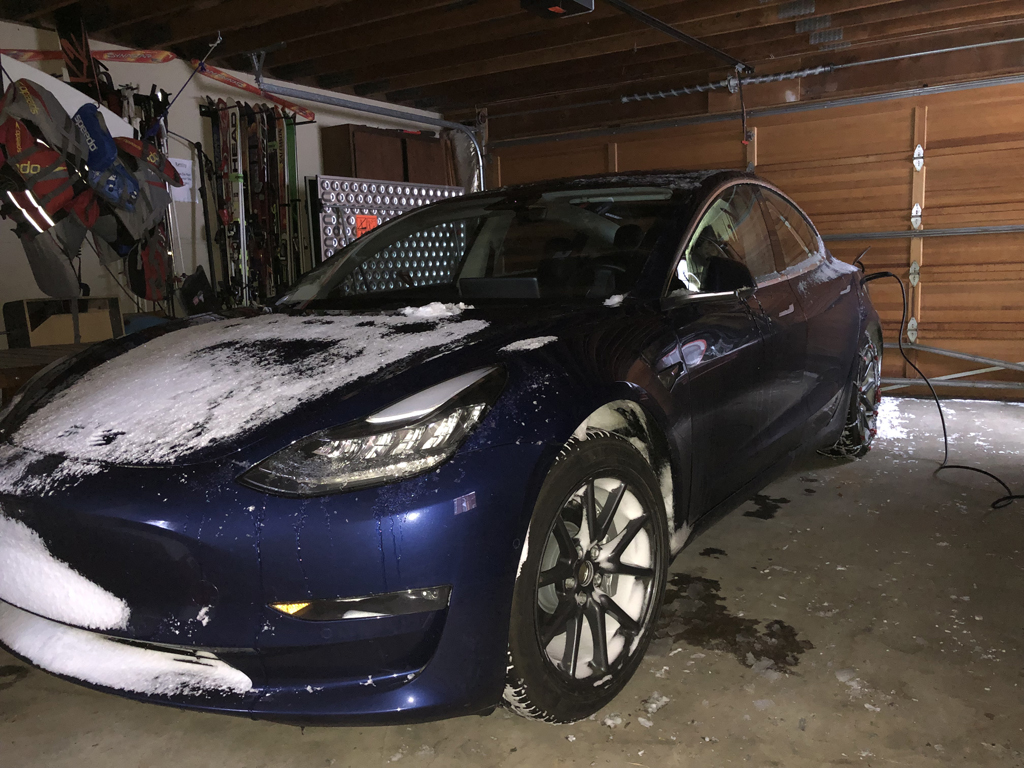 Snow on the hood of my car after driving through a heavy snow storm – no gas furnace throwing away heat under the hood.
Emissions Comparison: Energy comparisons are interesting, but carbon emissions are key. Burning one gallon of gas releases 19.6 lbs of CO2 pretty much no matter where you burn it. Seasonal variations in gas additives that are required in some regions of the U.S. can have a small effect on GHG. In contrast, electricity is made from a variety of sources including renewables like hydroelectric, geothermal, wind, and solar, or from nuclear fission, or by burning natural gas, coal, and petroleum. Each state uses a different mix of energy sources to make electricity, and therefore carbon emissions vary by region across the country. The EIA publishes annual updates on carbon emissions made by power plants within each state. I used those numbers to estimate our carbon footprint (e.g.: an average of 0.446 lbs of CO2 per kWh was released by power plants in California in 2019). Long story short, charging our Model 3 to drive 42,500 miles released 5,445 lbs of CO2.
Since each gallon of gas releases 19.6 lbs of CO2, 5445 lbs of CO2 is the equivalent of burning 278 gallons of gas (5,445 lbs ÷ 19.6 lbs/gallon = 278 gallons) to drive 42,500 miles. So for the emissions comparison, 5,445 lbs of CO2 is the amount of carbon emissions you’d get from driving a hypothetical gas-burning car that gets 152 MPG (42,500 miles ÷ 278 gallons = 152 MPG). Again, driving electric is much more efficient and produces fewer emissions. Our carbon footprint is not zero, but 5,500 lbs of CO2 is a big improvement over 15,700 lbs from a Prius, and a huge improvement over 33,300 pounds from a 25 MPG car. Right now every means of cutting emissions helps.
Driving Electric Reduced Our Carbon Footprint
Conclusion? Driving electric made an immediate and meaningful reduction in our family’s transportation carbon footprint. The 300+ mile range of our car combined with a nationwide rapid charging network allowed us to travel to all the places we wanted to go without compromise.
Methods
Energy Use: My calculations for energy use factor in: 1) Where we charged (Home vs. Supercharger); 2) Home Level 2 charging efficiency assumed to be 85%; 3) Supercharging efficiency assumed to be 92%; and 4) Estimate of energy used by BMS to maintain battery pack temperature and for Sentry Mode while car was parked.
Carbon Emissions: My estimate for carbon emissions from our EV were based on data published by the U.S. Energy Information Administration (EIA) on pounds of carbon emissions per MWh of electricity generated each year in each state. Calculations factor in: 1) Total kWh sent to the car; 2) Year; and 3) Emissions in states where we charged our car. The EIA is a division of the U.S. Department of Energy. From their website: “EIA collects, analyzes, and disseminates independent and impartial energy information to promote sound policymaking, efficient markets, and public understanding of energy and its interaction with the economy and the environment.“
Gas Emissions: Calculations for carbon emissions from driving a gas-powered car are based on: 1) on number of miles driven; 2) number of gallons of gas required to drive 42,500 miles in a 25 MPG car (42,500 ÷ 25 = 1700 gallons), or a 53 MPG Prius (42,500 ÷ 53 = 802 gallons); and 3) 19.6 lbs of CO2 released from burning each gallon of gas.
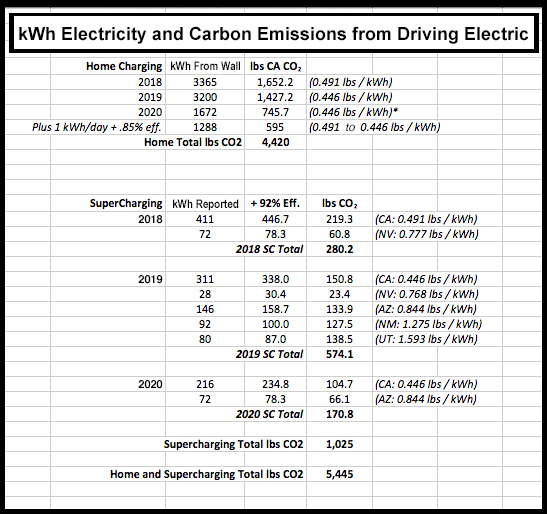 Excel screen cap of Carbon Emission calculations.
This guest post from Steve Noctor originally appeared on his blog It’s Electric.
We drove 42,500 miles in the first three years. I calculated how many kWh of electricity were sent to my car to charge the battery pack, and from that I estimated carbon emissions from producing the electricity.
I don’t have a separate meter to record energy use by my home charging station so I started with the amount of energy that the car reported using, and worked back from there. I took into account charging inefficiencies and estimated energy use by BMS and Sentry Mode – the UI currently reports energy use while driving. This is a back of the envelope estimate so keep in mind that YMMV.
Energy Use
11,100 kWh of electricity were used to charge my car over 3 years.
Here’s how I came up with that number: My car reported using 8429 kWh from the battery pack while driving. After taking into account efficiency of home Level 2 charging (I assume 85%), how many kWh I got from Superchargers (1428), and efficiency of Supercharging (I assume 92%), we get to 9789 kWh. I estimate an additional 1 kWh per day for BMS and Sentry Mode (+ 85% efficiency) = 1290 kWh. That totals 11,079 kWh – rounding up to 11,100 kWh. So 11,100 kWh to drive 42,500 miles. This gives us an efficiency from the wall of about:
3.8 miles per kWh261 Wh per mile16 kWh per 100 km.
Emissions
I estimate that our carbon emissions from three years of driving the Model 3 were 5,445 lbs of CO2 (See Methods and spread sheet at bottom for details). That’s just 17% of the emissions from driving the same distance in a 25 MPG car, and 34% of the emissions from a 2010 Prius. Driving an electric car produced an immediate and large reduction in our carbon footprint.
Comparing Gas and Electric Vehicles
There are two ways I compare the efficiency of gas and electric cars. One considers the kWh energy equivalent in a gallon of gas to compare the energy required to drive XX miles in gas-powered or electric cars. The second way is to compare emissions from driving electric versus gas.
Energy Equivalent Comparison: How does using 11,100 kWh to drive 42,500 miles compare to how much gasoline we would have used? One gallon of gas has the equivalent energy of 33.7 kWh of electricity. Using this approach, 11,100 kWh of electricity is the equivalent to the energy in 330 gallons of gas (11,100 kWh ÷ 33.7 kWh/gallon = 330 gallons). So 330 gallons of gas to drive 42,500 miles is like driving a car that gets 128 MPG. Electric cars are much more efficient than gas-powered cars and the reasons are straightforward: a lot of the energy released by burning gas is lost to heat and that sizable heat loss doesn’t happen with electric motors. Case in point: check out the snow on the hood of my electric car after driving 120 miles through a snow storm.
Emissions Comparison: Energy comparisons are interesting, but carbon emissions are key. Burning one gallon of gas releases 19.6 lbs of CO2 pretty much no matter where you burn it. Seasonal variations in gas additives that are required in some regions of the U.S. can have a small effect on GHG. In contrast, electricity is made from a variety of sources including renewables like hydroelectric, geothermal, wind, and solar, or from nuclear fission, or by burning natural gas, coal, and petroleum. Each state uses a different mix of energy sources to make electricity, and therefore carbon emissions vary by region across the country. The EIA publishes annual updates on carbon emissions made by power plants within each state. I used those numbers to estimate our carbon footprint (e.g.: an average of 0.446 lbs of CO2 per kWh was released by power plants in California in 2019). Long story short, charging our Model 3 to drive 42,500 miles released 5,445 lbs of CO2.
Since each gallon of gas releases 19.6 lbs of CO2, 5445 lbs of CO2 is the equivalent of burning 278 gallons of gas (5,445 lbs ÷ 19.6 lbs/gallon = 278 gallons) to drive 42,500 miles. So for the emissions comparison, 5,445 lbs of CO2 is the amount of carbon emissions you’d get from driving a hypothetical gas-burning car that gets 152 MPG (42,500 miles ÷ 278 gallons = 152 MPG). Again, driving electric is much more efficient and produces fewer emissions. Our carbon footprint is not zero, but 5,500 lbs of CO2 is a big improvement over 15,700 lbs from a Prius, and a huge improvement over 33,300 pounds from a 25 MPG car. Right now every means of cutting emissions helps.
Driving Electric Reduced Our Carbon Footprint
Conclusion? Driving electric made an immediate and meaningful reduction in our family’s transportation carbon footprint. The 300+ mile range of our car combined with a nationwide rapid charging network allowed us to travel to all the places we wanted to go without compromise.
Methods
Energy Use: My calculations for energy use factor in: 1) Where we charged (Home vs. Supercharger); 2) Home Level 2 charging efficiency assumed to be 85%; 3) Supercharging efficiency assumed to be 92%; and 4) Estimate of energy used by BMS to maintain battery pack temperature and for Sentry Mode while car was parked.
Carbon Emissions: My estimate for carbon emissions from our EV were based on data published by the U.S. Energy Information Administration (EIA) on pounds of carbon emissions per MWh of electricity generated each year in each state. Calculations factor in: 1) Total kWh sent to the car; 2) Year; and 3) Emissions in states where we charged our car. The EIA is a division of the U.S. Department of Energy. From their website: “EIA collects, analyzes, and disseminates independent and impartial energy information to promote sound policymaking, efficient markets, and public understanding of energy and its interaction with the economy and the environment.“
Gas Emissions: Calculations for carbon emissions from driving a gas-powered car are based on: 1) on number of miles driven; 2) number of gallons of gas required to drive 42,500 miles in a 25 MPG car (42,500 ÷ 25 = 1700 gallons), or a 53 MPG Prius (42,500 ÷ 53 = 802 gallons); and 3) 19.6 lbs of CO2 released from burning each gallon of gas.
This guest post from Steve Noctor originally appeared on his blog It’s Electric.
Last edited by a moderator:
