Welcome to Tesla Motors Club
Discuss Tesla's Model S, Model 3, Model X, Model Y, Cybertruck, Roadster and More.
Register
This site may earn commission on affiliate links.

Krash

Data Technician
Moderator
Apr 18, 2017
3,245
3,797
Intermountain US
Listings
This thread, and particularly this continually updated post, is set up as both a Tesla Physics Index as well as a thread for new physics concepts.

Although started in the Model S Driving Dynamics Sub Forum it is a general discussion across all vehicles.

Files, when added, will be attached below

Projects
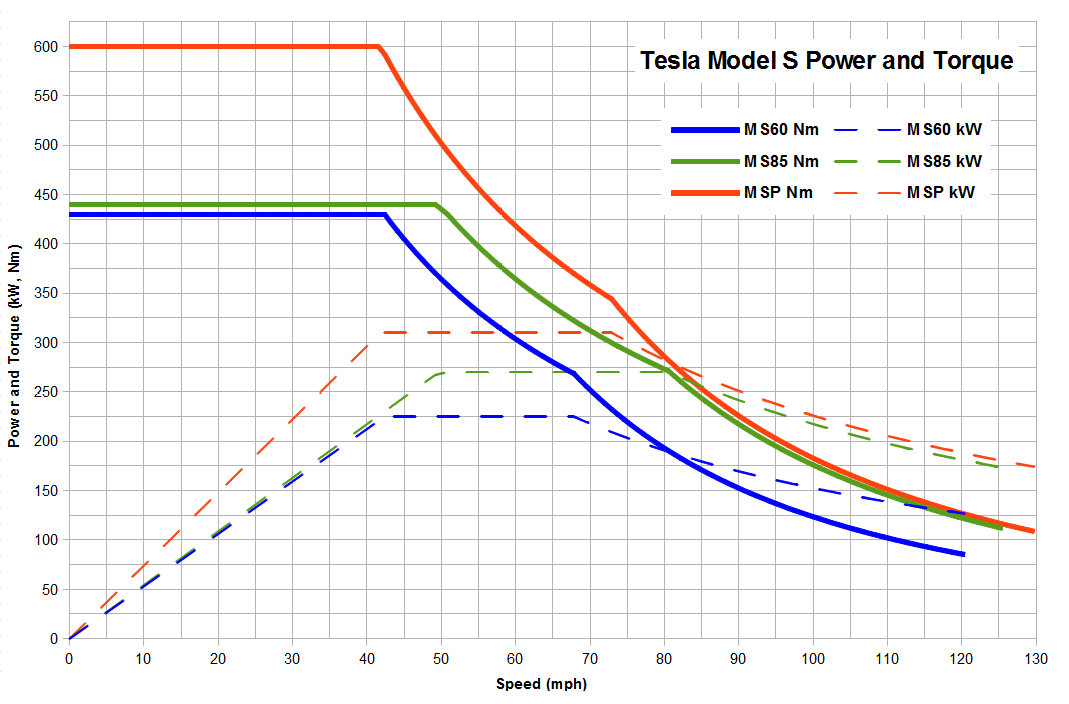
Performance Metrics Summary
Deriving Performance Limits from observed CAN and API data
Torque Limit
Current (Ampere) Limit​
Aerodynamics
Cd: Drag Coefficient
Crr: Rolling Resistance Coefficient
Wheel, Tire, Size, Material and Design effect on effeciency​
Braking
Thermal Limits
State of Charge Effect on Performance
Performance Cars
Non Performance Cars​
State of Charge Effect on Battery Charging
Battery Configuration
Ultra and Supercapacitors
Inverters
Efficiency
Change from variable to fixed frequency​
Skidpad
Torque Vectoring
Weight distribution Transfer under acceleration
Downforce
Tire Traction
F≤µN model (static friction (F) is less than or equal to the coefficient of friction (µ) times Force​
2020 Roadster Thrusters
We appreciate referrals to physicists, engineers and mathematicians.
 
Last edited:
So here is the graph that got me thinking about this:
tesla-model-s-power-and-torque-5377830577086430255.png

I will post the original source if anyone can verify it.

Although I plot time rather than speed on the x axis, the observed data in the Performance Metrics Tracking is similar. One can clearly see four different periods here: fixed torque, maximum power, what I believe to be current limits against aerodynamics and finally max velocity (related to maximum motor RPM). We are ignoring thermal limits and things like launch mode in the simple model.
 
Last edited:
  • Informative
Reactions: Big Earl and Bebop
Notice how the initial slope of the power over time is slightly steeper for the S85 than the S60, and considerably steeper for the performance model. And notice how the torque is fixed for that period for the three cars at three levels.

Watching the CAN bus, the car will tell us the torque. We have data from MikeBur and Bill D torque data which does look like the graph above. Unfortunately CAN data is hard for most owners to obtain.

Since the power, velocity, GPS data is all available from the API and readily available mobile apps, it would be really handy to estimate that assumed torque limit from the observed power, changes in power and other data.
 
Last edited:
One can clearly see four different periods here: fixed torque, maximum power, what I believe to be current limits against aerodynamics and finally max velocity (related to maximum motor RPM). We are ignoring thermal limits and things like launch mode in the simple model.
I don't agree with your description of the third period. The aerodynamic limit isn't reached until the aerodynamic drag equals the maximum motive force the car can put out, at which point the speed remains constant because it can no longer go faster, but that point is not shown on the graph. Indeed, due to software limiting the maximum motor RPM, it may be limited from reaching that point.
 
  • Like
Reactions: John G
Computing torque from data on power versus time

Work, W, done by a torque, τ, moving through an angle, θ, is given by:

W = τ ∙ θ

We will assume that torque is constant over time, as portions of the graphs above demonstrate. Power, P, as a function of time, is the time derivative of work:

P(t) = d/dt (τ ∙ θ) = τ ∙ ω(t)

where ω(t) is the angular velocity as a function of time.

Now, we know that the angular velocity, ω(t), of the tire is given by the speed of the vehicle, v(t), divided by the radius of the tire, r:

ω(t) = v(t) / r

So far, we have:

P(t) = τ ∙ v(t) / r

Now, we also know that the speed is directly related to the acceleration (assumed constant), a:

v(t) = a ∙ t

Further, we know that the acceleration, a, of a mass, m, is related to the force, F, via Newton's second law of motion:

F = m ∙ a

The accelerating force, F, is produced by the torque acting at the radius of the tire:

F = τ / r

Thus:

v(t) = (F / m) ∙ t = τ / (r ∙ m) ∙ t

Finally, we have a direct relationship between power and torque:

P(t) = τ ∙ v(t) / r
P(t) = τ ∙ [τ / (r ∙ m) ∙ t] / r
P(t) = (τ / r)² / m ∙ t

Now we can rearrange this to find torque:

P(t) = (τ / r)² / m ∙ t
P(t) ∙ m / t = (τ / r)²

Or:

τ = r ∙ √ [m ∙ P(t) / t]

For an approximately linear rise of power, P(t) / t is simply the rate of change of power, dP(t)/dt, or ΔP/Δt:

τ = r ∙ √ [m ∙ ΔP/Δt]

So now let us apply this computation to determine the torque in the example posted here: Any news on 100D uncorking?

This shows a total power increase of 421 kW in approximately 3 seconds of fairly constant rise (it's hard to measure accurately because of the way the graph starts before zero). Thus, ΔP/Δt = (421 kW / 3.0 s) = 140.3 kW/s. Assuming a tire radius of 0.35 m and the vehicle mass of 2200 kg (per Wikipedia), we get:

τ = r ∙ √ [m ∙ ΔP/Δt] = (0.35 m) ∙ √ (2200 kg ∙ 140.3 kW/s) = 6150 N∙m

This gives the torque delivered to the wheel. However, torque performance is commonly stated for the engine. Similarly, we want to know the torque generated by the motors for comparison purposes with engine specifications. The torque of the motor is multiplied by a gearing system attached to the motors. For the non-performance dual motor Model S, the gear ratio is 9.73 for the rear motor and 9.34 for the front motor. If we assume that both motors are putting out equal torque, then we solve for the motor torque, Τ, using algebra:

Τ * 9.73 + Τ * 9.34 = 6150 N∙m
Τ * (9.73 + 9.34) = 6150 N∙m
Τ * (19.07) = 6150 N∙m
Τ = 6150 N∙m / 19.07
Τ = 322.5 N∙m

Since there are two motors, the total motor torque is therefore 644 N∙m, which is slightly higher than the estimate listed in that post. A very good agreement with the rough value of the time to reach 421 kW, and the approximate radius of the tire, in my opinion. If someone would be willing to measure the height of the center of the wheel hub from the ground (in mm) on a Model S 100D, I suspect it will be slightly less than 350 mm because of tire deformation due to the weight of the vehicle. The actual measurement will provide more precise computations.

And if we want to know the lateral acceleration, we compute it from the torque at the wheels:

a = F / m = τ / r / m
a = 6150 N∙m / 0.35 m / 2200 kg = 8.0 m/s² = 0.81 g

Physics works!
 
Last edited:
I don't agree with your description of the third period. The aerodynamic limit isn't reached until the aerodynamic drag equals the maximum motive force the car can put out, at which point the speed remains constant because it can no longer go faster, but that point is not shown on the graph. Indeed, due to software limiting the maximum motor RPM, it may be limited from reaching that point.
I don't mean that the aerodynamic limits are reached. The gearing on the car and the rpm limits, not to mention the top speed limits kick in beforehand. What I mean is that the car transitions from a max power limited state to one where aerodynamic drag and rolling resistance have enough force to cause the current ampere limit to keep the car from max power.
 
Last edited:
I don't mean that the aerodynamic limits are reached. The gearing on the car and the rpm limits, not to mention the top speed limits kick in beforehand. What I mean is that the car transitions from a max power limited state to one where aerodynamic drag has enough force to cause the current ampere limit to keep the car from max power.
I didn't understand this at all. Drag can't stop the car from attaining max power. It can only how fast the car can go while under max power.
 
  • Like
Reactions: Big Earl and yak-55
I should point out that the computations above in my "Computing torque from data on power versus time" post were theoretical and neglected parasitic losses. The power measurements were power delivered to the motors, not to the car. The motors dissipate some of this power as heat, due to I²R losses and other magnetic induction. Furthermore some of the torque and power is lost overcoming friction in the drive train and flexing of the tires. Therefore, the actual torque values available at the wheels (and linear acceleration) will be reduced by some amount.With the actual numerical data, I could probably compute how much of the power and torque is lost.

For example, using the data I cited in that post, it appears that the 0-40 mph (0-17.9 m/s) time is about 2.5 s. The actual acceleration up to that speed (the point after which the torque is no longer constant) is:

a = Δv/Δt = (17.9 m/s) / 2.5 s = 7.15 m/s² = 0.73 g

which is about 10% lower than the theoretical acceleration, above (8.0 m/s²). And the actual torque to the wheels would be:

τ = m ∙ a ∙ r = 2200 kg ∙ 7.15 m/s² ∙ 0.35 m = 5507 N∙m

which is about 10% lower than the the theoretical torque above (6150 N∙m).

But these numbers are from a rough estimate from curves on the diagram that aren't aligned with time zero. More accurate results would be possible with access to the actual numerical data.
 

I don't mean that the aerodynamic limits are reached. The gearing on the car and the rpm limits, not to mention the top speed limits kick in beforehand. What I mean is that the car transitions from a max power limited state to one where aerodynamic drag has enough force to cause the current ampere limit to keep the car from max power.

Like SucreTease, I'm confused by this comment. The motor's maximum power vs RPM curve should be the same on a dyno with no aero loads as it is with a 70 knot headwind on the road. (The car's acceleration will of course be very different, but the motor should produce the same power at any given speed.)

That third phase has something limiting the power output due to high rotor speeds - maybe some sort of back EMF effect (mostly a problem with PM motors, but I think you can get a version of it with an induction motor?)
 
This may be an incorrect assumption on my part. Or I may just be using the wrong terms.

What causes the power output to trend downward again to after (the right of) max power over time (or velocity)? i.e. after 60 mph on the S60? I have assumed that the car reaches the current (ampere) limits of the battery. Any other theories?

And if it is true that the ampere limits are reached while the car velocity is increasing, we also happen to know that the car is not accelerating - the velocity is increasing but at a decreasing rate so technically the car is decelerating. And by looking at the curve we know that it isn't linear. The power drop (at my assumed constant amperes) from 70 mph to 80 mph is greater than the power drop from 80 mph to 90 mph. Why? I assume it is from aerodynamic forces - either drag or rolling resistance. In a vacuum would that drop be linear?

If it were a back EMF effect caused by increasing rotational speed, wouldn't the drop increase over time as rotational speed increases, instead of the observed decrease?
 
Last edited:
Regardless of whether there are aerodynamic forces at play, can we estimate the current limit is in amperes from observed data? Either by looking at the first point at which the power drops below max power? Or by looking at the shape of the drop in power over time from that point? Or both?
 
the velocity is increasing but at a decreasing rate so technically the car is decelerating.

No, if it the velocity is increasing, the car is accelerating. It is the rate of velocity increase (acceleration) that is decreasing. Interesting that this video came
out today, explaining that change in acceleration is called jerk. So, the car is dejerking, I guess.
 
Last edited:
  • Like
Reactions: dhrivnak
What causes the power output to trend downward again to after (the right of) max power over time (or velocity)? i.e. after 60 mph on the S60? I have assumed that the car reaches the current (ampere) limits of the battery. Any other theories?
I am still trying to understand the theory on this, and it is not simple, but a convex power curve is quite typical of electric motors. Design parameters of a motor allow one to trade-off various attributes of the torque curve, the power curve, maximum RPM, etc. But ultimately they always behave this way. Here are a couple of links that show this:

D.C. Motor Torque/Speed Curve Tutorial:::Understanding Motor Characteristics
https://evmc2.files.wordpress.com/2014/07/motorcurve.gif
http://www.electriccarpartscompany....V-96V-108V650AHPEVSEVACMotorandController.jpg

And if it is true that the ampere limits are reached while the car velocity is increasing, we also happen to know that the car is not accelerating - the velocity is increasing but at a decreasing rate so technically the car is decelerating.
Okay, this is some crazy talk. If the speed of a vehicle is increasing, it is accelerating—not decelerating. The very definition of acceleration is a positive rate of change, meaning that the value will be higher at a later time than it is now. Yes, the magnitude of the acceleration is dropping, but it is still accelerating.

Do not assume that current limits are artificially imposed here. As a motor turns faster, back-EMF (a reverse voltage induced in the motor by the movement of coils of wire through a magnetic field) becomes stronger, meaning that the voltage applied to the motor that pushes current through it, it fighting a reverse voltage which subtracts from it, reducing the effective voltage and, therefore, the current it causes. It is a property of electromagnetic systems to oppose changes applied to them.

And by looking at the curve we know that it isn't linear. The power drop (at my assumed constant amperes) from 70 mph to 80 mph is greater than the power drop from 80 mph to 90 mph. Why? I assume it is from aerodynamic forces - either drag or rolling resistance. In a vacuum would that drop be linear?
That is the nature of the power curve, whose examples I linked above. I do not understand the general principles of motor design enough yet to explain it. The examples I can explain are simple D.C. motors, not multi-phase A.C. motors.

The first two portions of the torque curve at the beginning of this thread look like the D.C. example explained here: Speed-Torque - Step Motor Basics - Support | GeckoDrive

As my theory above explained, power is related to torque and rotation by P(ω) = τ(ω) ∙ ω.

In the first portion of the diagram above, torque is constant, so the power increases linearly with increasing ω, which we see in the diagram. In the second portion, we see that torque is inversely proportional to ω, so that τ(ω) = A / ω, where A is a constant, such that P(ω) = τ(ω) ∙ ω = A / ω ∙ ω = A and, thus, the power is constant across that range. In the third portion, the torque takes on a different relationship to angular speed that, by my quick computations, looks like τ(ω) = A / ω + B, where A and B are constants (A > 0, B < 0). This leads to P(ω) = τ(ω) ∙ ω = (A / ω + B) ∙ ω = A + B ∙ ω, means that the power linearly decreases with increasing ω (though the diagram above shows it decreasing with a slightly concave shape, meaning that my estimation of the torque curve in that portion isn't quite right, but close enough to explain the shape).
 
  • Like
Reactions: dhrivnak
Okay, this is some crazy talk. If the speed of a vehicle is increasing, it is accelerating—not decelerating. The very definition of acceleration is a positive rate of change, meaning that the value will be higher at a later time than it is now. Yes, the magnitude of the acceleration is dropping, but it is still accelerating.

Since the purpose of this thread is physics discussions, avoid more colloquial concepts of "acceleration" and "deceleration," as this is already leading to equivocation of terms and confusion therein. Acceleration is change in velocity with respect to time. The magnitude and direction describe the acceleration, but do not change the definition. That is to say, any change in velocity is due to acceleration.
 
  • Informative
Reactions: dhanson865
So off the direct topic of physics, there are four primary limit differentiation points between cars: torque limit, current limit or power limit and max speed limit, right? It is just that the current limit or the power limit happen at the same time from acceleration, but which one limits first depends on the car. So a S75D BTX5 is current limited by the battery limit of 1350A (uncorked, up from 1100A corked). But a S75D BTX8 is power limited at 415kW (by the MCU?) so you never reach the 1500A of that battery. And of course that 415kW is artificial since the car is likely identical to the 425kW limited S100D. But if you dropped that S100D 1800A battery into an S75D you would likely get the 415kW limit.

Could it be that cars with a close power and current limits are especially prone to changes in performance based on state of charge? And that cars with a big gap between power and current limits (like the S100D) are not? How complicated is max power as a function of state of charge? Or initial acceleration as a function of state of charge?

And back on the physics topic of whether we can tell the current (ampere) limit of the cars from the performance data - specifically of the S100D and rare BTX8 S75D which may have an artificially low power limit well below the batteries capability. What would happen to the graph of the current (amperes) if we had empirical CAN data for this third period where the power normally declines? The power would continue at max power but the current in amperes would climb right to the max amperage of the battery right, and then power would start to fall off after max battery current is reached?

Anyone following along with a 100D and a CAN logger want to do a quarter mile run?
 
Last edited:
Since the purpose of this thread is physics discussions, avoid more colloquial concepts of "acceleration" and "deceleration," as this is already leading to equivocation of terms and confusion therein. Acceleration is change in velocity with respect to time. The magnitude and direction describe the acceleration, but do not change the definition. That is to say, any change in velocity is due to acceleration.
While technically correct, this entire subject covers motion in one dimension, and all cross-products are at right-angles, so scalar values (magnitudes only) are entirely warranted. Also, what you call "colloquial" terms have clear, precise dictionary definitions, and I do not believe that either me or @Krash meant them any other way. Accelerate means to move faster, decelerate means to reduce speed. This is how the terms were used by me and @Krash. Unless @Krash wants to correct me here, the confusion was about concepts, not words.
 
So off the direct topic of physics, there are four primary limit differentiation points between cars: torque limit, current limit or power limit and max speed limit, right?
I don't believe that those are the only limits. The are voltage limits, thermal limits, heat dissipation limits, current saturation limits, etc. Not to mention performance limits on various components used throughout the power chain. The power chain was designed with a given performance goal, and components were individually selected that support that goal, with the assurance that each component either meets or exceeds the requirements upon it. The supply chain may have mixed equivalent components from different manufacturers, some of which met its requirements and others exceeding them. Later, when one wishes to change the performance goal with the existing components, one must carefully determine whether each component can support the higher goal. This requires careful testing and proving before unleashing the change.

Though not implying this applies to the present audience of this thread, I am kind of distressed at the way that many people on these forums tend to fall into an anti-corporate conspiracy mentality that Tesla is not acting in good faith and deliberately withholding performance arbitrarily from certain classes of owners. The are very good engineering reasons to go carefully and deliberately, and reasons that some cars can support a change of performance and some cannot.
 
I don't believe that those are the only limits...
By primary limit differentiation points I mean the limits that are set differently between car models, limits that aren't directly related to differences in hardware. Although I think the other limits are interesting. The PT_BMS_ISENSORPROTOCOLNUMBER limit determining which cars get uncorked is certainly a hot topic, even if it is a proxy for a lot of other hardware.
...distressed at the way that many people on these forums tend to fall into an anti-corporate conspiracy...
Agreed. The whining and complaining does not go unnoticed at corporate.