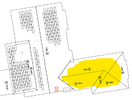
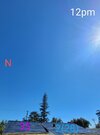
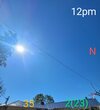
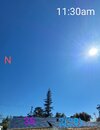
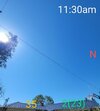
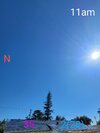
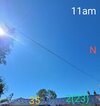
Looking for advice, opinions, assistance regarding the curve - we have been battling with Tesla Customer Service to have them come out to run diagnostics as to why our solar generation drops by ~1kW at 11am. Ideas?
***Images are the better days, 70% of the time it is really ugly***
.png")
.png")

***Images are the better days, 70% of the time it is really ugly***