Welcome to Tesla Motors Club
Discuss Tesla's Model S, Model 3, Model X, Model Y, Cybertruck, Roadster and More.
Register

Tesla, TSLA & the Investment World: the Perpetual Investors' Roundtable

This site may earn commission on affiliate links.
Right now the only evidence we have is Tesla’s general credibility earned from a track record of past achievements.

We do occasionally see motor patents from Tesla. I look forward to a public announcement of this new art as soon as Tesla is ready to reveal it. If the world hopes to produce 1.4 billion EVs over the next few decades, we will need to cut our dependance upon rare earth magnets for motors.

Cheers!
 
I immediately noticed that the model 3 image shown on the slide was different than the current model, so it's good to have a proper comparison done here. Although, since the highland "rework" is supposed to fill in some design gaps/improvements while streamlining the build process as much as possible, while I can understand changing some body components to do so, I don't understand how changing the shape of the car (even the dimensions appear to have changed) helps in doing that. Model 3 is already slightly too long for some (eu?) markets imho.

It is just perspective... tech specifications often depict cars using orthogonal perspective which makes them look longer.
 
For the European countries that we get daily updates for deliveries look pretty good so far (these made up 17% of the total European market in 2022, so take with a grain of salt as (hypothetical) bad numbers in bigger countries could reverse the trend). Also interesting how deliveries in the beginning of the quarter were much higher than in previous quarters, probably because of Giga Berlin.

Screenshot 2023-03-22 at 12.01.22.png

 
(This is regarding the letter you posted nothing in your text)

This is just a pet peeve of mine. I hate when I see people say batteries “Produced” power.

It’s not what they do, and honestly doesn’t reflect what makes them such an incredibly awesome addition to the grid. Batteries are time machines for energy. They move power from when you don’t need it to when you do need it. With every other power source on the grid, you can only produce a set amount of power and if there is spare power it is a burden on the grid to deal with it.

Nobody talks about the billions of GWH of energy that gets wasted on the traditional fossil fuel grid just due to excess capacity wasted and due to peaker plants firing up and shutting down to fill short term gaps in power needs.

Batteries don’t produce power, they take free power that’s not being used and move it to when it is needed most. They do it in an instant and invisibly. Nothing else can do this.

/rant
apologies a _tiny_ bit if answered later
==>LOOK<== at the diagram, It visually emphasizes Ogre's point
97 Quadrillion BTU's of energy used (left side)(just for US, dont have world energy chart)
65 Quadrillion BTU's of energy literally wasted
IF ONLY WE COULD TIME SHIFT ENERGY (hint: ==>BATTERIES<== (ya know, megapacks)
(36.6 Quads electricity made, 23.7 wasted)
(?how much more efficient are EV's of all kinds vs thermal engines?)
3:1? 4:1?
literally free energy, already paid for, already produce, then wasted,
It seriously takes a mental paradigm shift
Energy_2021_United-States_0.png
 
Pause is the only logical choice. Powell is nothing if not logical.

Last week European central bank continued rate hikes as planned ignoring banking crisis..
One argument for continuing that circulated was that stopping might induce more fear (
by admitting there was a serious problem)..

Just saw now they are saying "future rate hikes are open":
 
Randy Kirk has been interviewing Joe Justice in a three part series. Part 2 is out now (linked below) and Joe touches on the future economy and the vision he has extracted from statements made by Elon and others involved in Musk companies.

In particular, his analogy of a circa 1400's "shell trader" trying to understand the scope and workings of today's economy paints a picture of just why many people are not grasping the implications for the future the Musk-owned companies are converging to create.

Well worth a watch. (despite Joe's 70's porn star look ;) )

 
apologies a _tiny_ bit if answered later
==>LOOK<== at the diagram, It visually emphasizes Ogre's point
97 Quadrillion BTU's of energy used (left side)(just for US, dont have world energy chart)
65 Quadrillion BTU's of energy literally wasted
IF ONLY WE COULD TIME SHIFT ENERGY (hint: ==>BATTERIES<== (ya know, megapacks)
(36.6 Quads electricity made, 23.7 wasted)
(?how much more efficient are EV's of all kinds vs thermal engines?)
3:1? 4:1?
literally free energy, already paid for, already produce, then wasted,
It seriously takes a mental paradigm shift
Energy_2021_United-States_0.png
You may be misunderstanding the data. 36.6 is total energy used to generate electricity, not 36.6 of electricity generated. 23.7 is the inefficiency of generation, not generated-but-unused energy.

Nuclear plant: 35% efficiency (avg)
Gas baseload: 45-57%
Gas peaker plant: 20-42% eff typical, 30-42% new

Dropping peakers via storage boosts efficiency by removing less efficient peaker plants and allowing steady baseload operation, but doesn't make up for thermodynamic losses.
nope, 2/3 of generated electricity is wasted, that could be stored in batteries, go back and understand the chart
 
nope, 2/3 of generated electricity is wasted, that could be stored in batteries, go back and understand the chart
The chart footnote literally says:"The efficiency of electrical production is calculated as the total retail electricity delivered divided by the primary energy input into electricity generation"

Rejected energy is wasted primary input energy, not wasted output electricity. You can have unused capacity, but you can’t have unused generation (without bad things happening).
I guess I have been misunderstanding those charts for the last 15 years or so, having that data that goes back to the early 1950's.
I shall reach out to one of the folks at LLNL for clarifications in the near future, though they may have retired
 
For the European countries that we get daily updates for deliveries look pretty good so far (these made up 17% of the total European market in 2022, so take with a grain of salt as (hypothetical) bad numbers in bigger countries could reverse the trend). Also interesting how deliveries in the beginning of the quarter were much higher than in previous quarters, probably because of Giga Berlin.

View attachment 920103

I noticed this too. And in the context of other manufacturers, you can see how the sales have jumped over the last couple of weeks:

One of these is not like the others....

download.png

Edited to add source: eu-evs.com

As you say, this is only for the countries that report daily registrations (Spain, Netherlands, Norway and Sweden). We'll have to wait till the end of the quarter to see what the numbers are like from other EU countries, but anecdotally it looks promising.

Tesla sales in China also seem to be holding up well, particularly compared to others.

I always try to caution against putting too much weight on one quarter of numbers, but given the current macro environment a good Q1 would go a long way to quelling some of the fears some people have had (particularly given that Q1 is historically seen as a weaker quarter in the auto industry).
 
Last edited:
I guess I have been misunderstanding those charts for the last 15 years or so, having that data that goes back to the early 1950's.
I shall reach out to one of the folks at LLNL for clarifications in the near future, though they may have retired
They do explain it.
Finally the chart depicts how much energy is put to good use in those areas and how much of the energy passes through is rejected energy to the environment. We're always asked, "what is rejected energy?" Rejected energy is the portion of energy that goes into a process that comes out generally as waste heat to the environment. So, if you can think of the total amount of energy that goes into your car's gas tank, a certain amount of that goes to drive the wheels forward, that's an energy service. The energy that comes out as heat transfer from your radiator or energy and the hot exhaust out the tailpipe, that's rejected energy.
Edit: newer video, electricity at 3:00

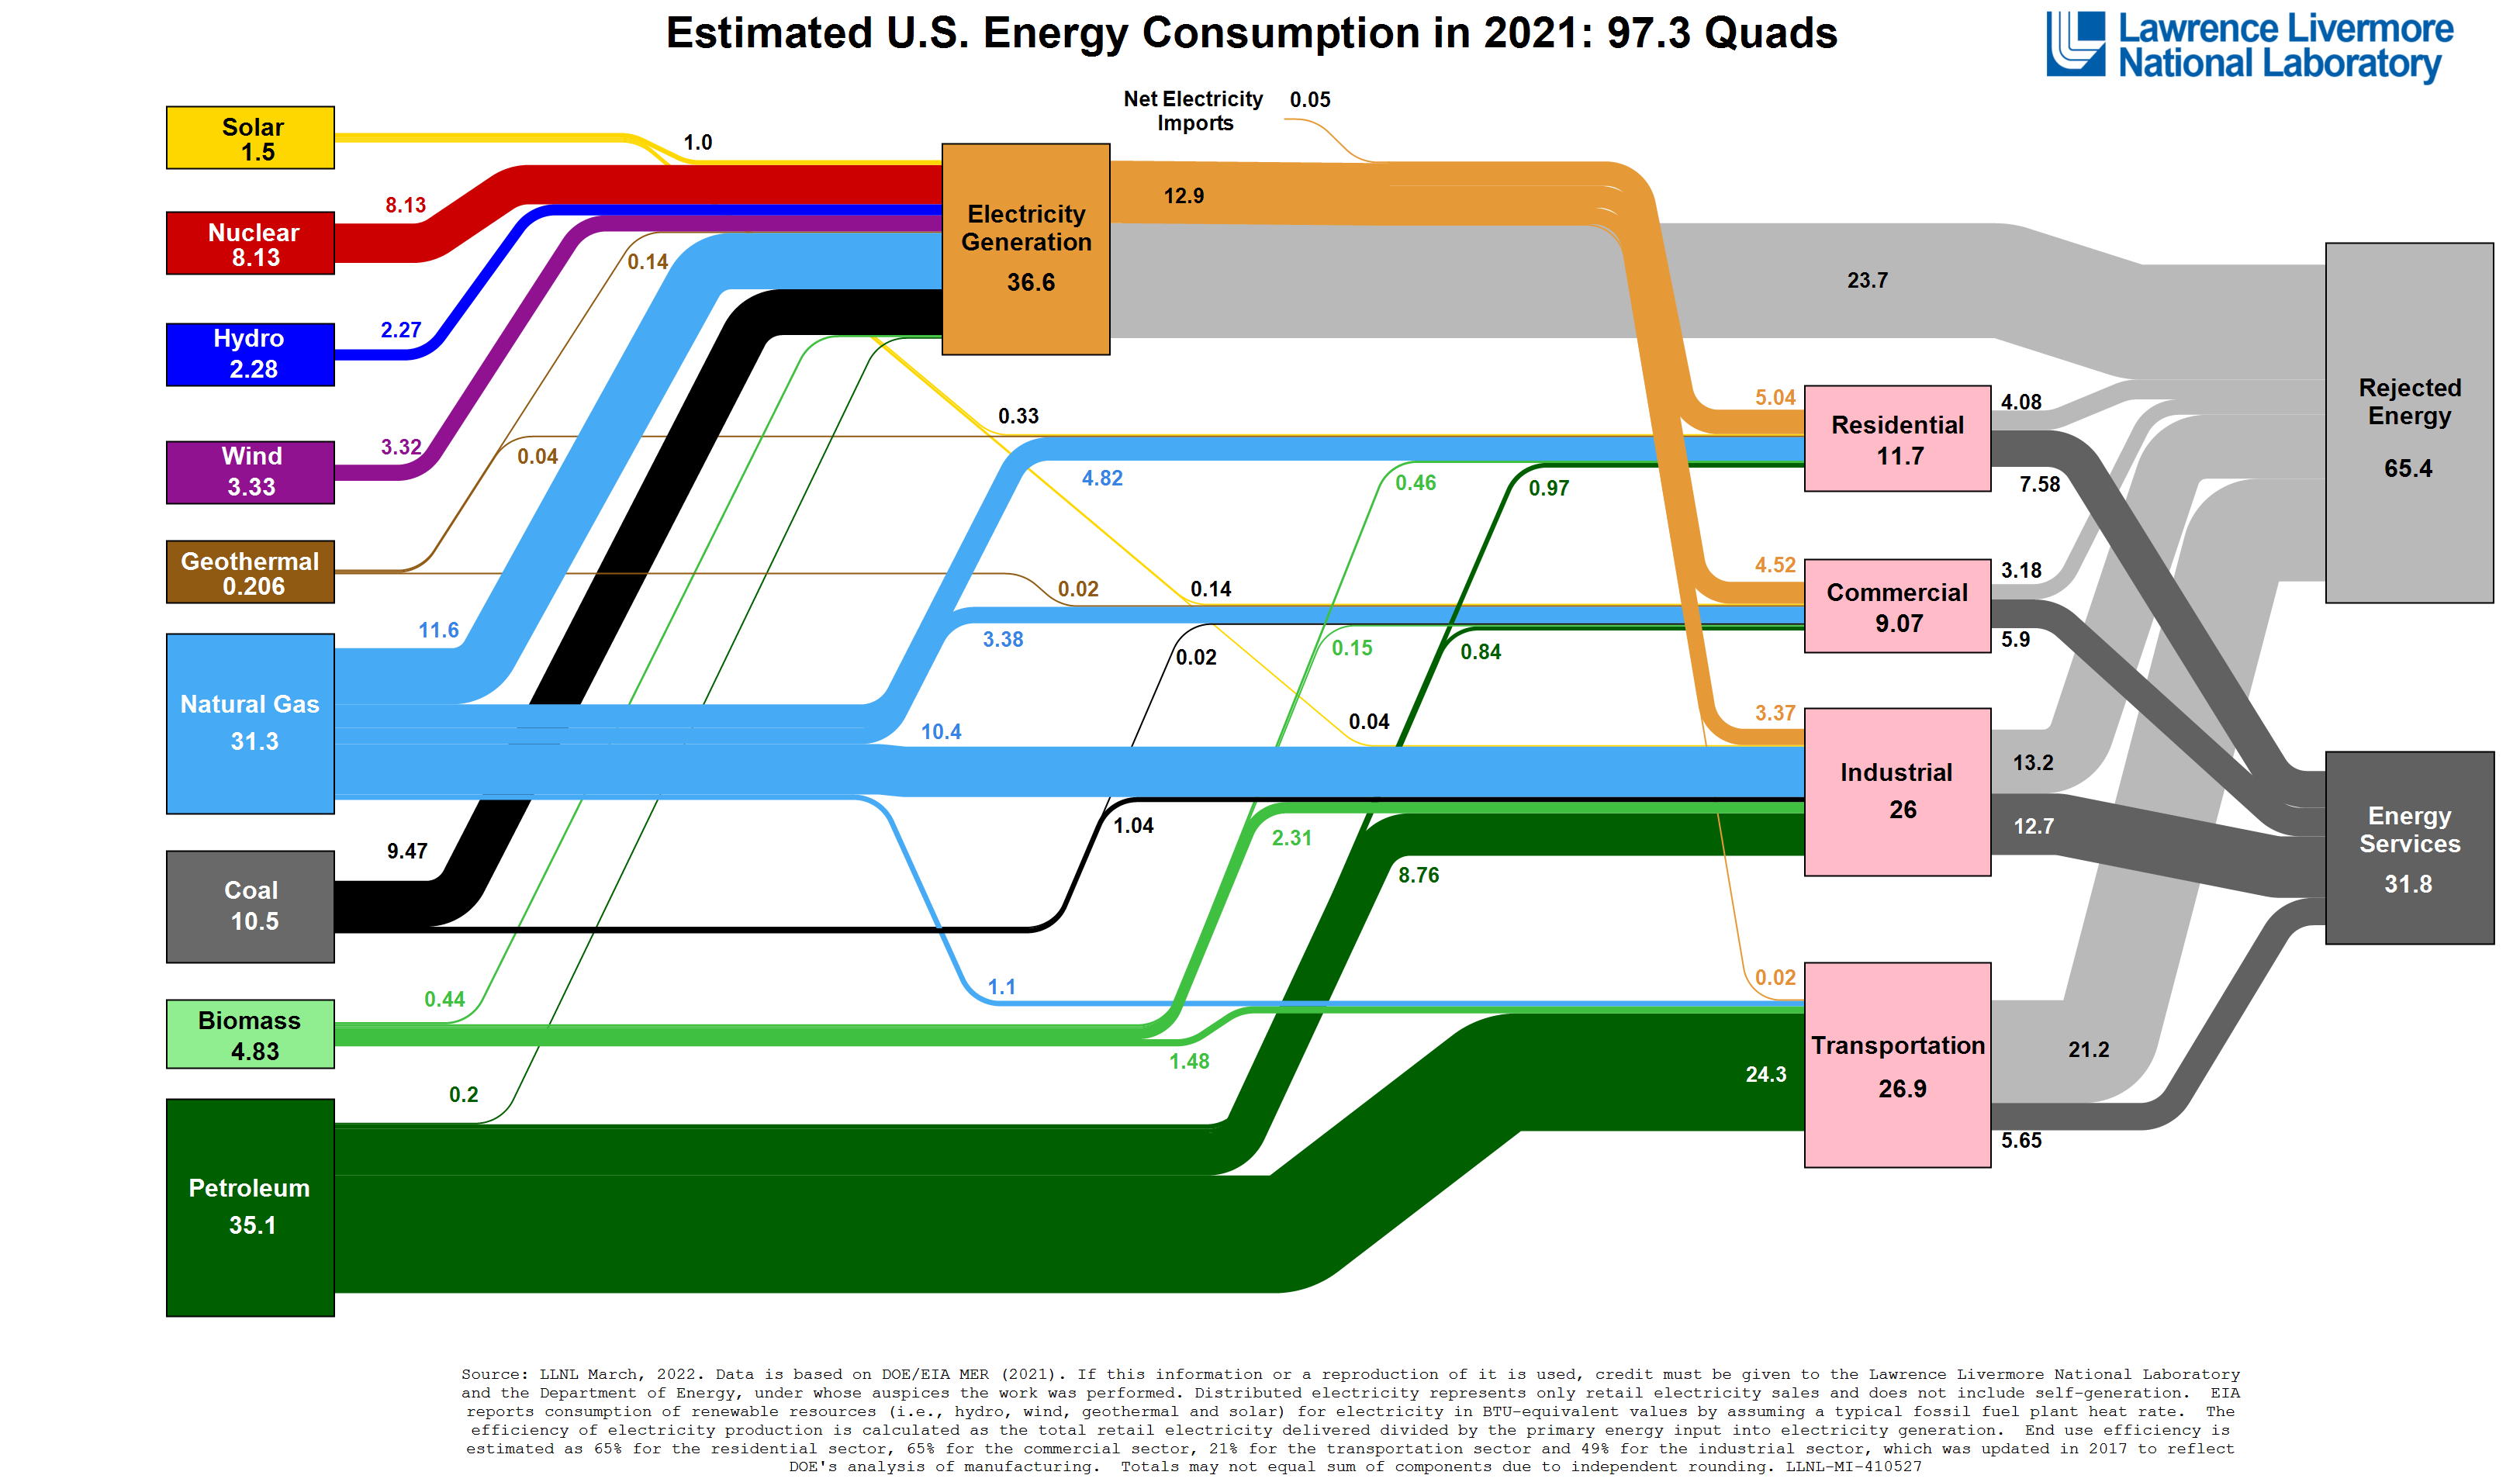
and when we see that rejected energy category what does that mean? Where does that come from?

So the rejected energy is a energy that is returned back to the environment and it's lost due to its low temperature. It's unavailable for any use or it has no economic value at all and it's just released back into the environment.

Whenever we transform energy from one form to another we lose some energy to the environment.

The first law of thermodynamics states that energy cannot be created or destroyed and the second law of thermodynamics says that whenever we play around with energy some of its quality gets degraded.

So like when my car engine gets hot that's like some of my oil's energy being wasted back into the environment as a rejected energy.

Exactly.

That's pretty much one of the biggest questions that we get about the flow charts is like people really focus in on that rejected energy and people always wonder if there are ways that we can reduce that rejected energy you know? On an individual level or on a larger level. What do you say to that?

So if you make like a lighter more aerodynamic car you need less energy to give you the service, so you reject less energy in providing it.

So another example might be doing a better job of insulating your house. You need less energy to heat or cool it.

Better energy technology can make transformations of energy more efficient so today's cars even the ones that are bigger and heavier than the cars from the 1970s get much better mileage because of better engine technology.

Things like fuel injection and turbo charging and low friction materials or another example would be LED lights that provide us with better more controllable illumination than incandescent bulbs and they create a lot less heat in the process.
 
Last edited:

This is the 22nd short video Tesla has posted on YouTube in the last five months and the 15th in just 2023. It seems Tesla actually has begun earnestly advertising, though still without paying for promoting the videos.
Given that I suspect 90% of folks from GenX onwards consume more of their content online and have DVR's where they can skip commercials, it's genius.

I, a GenX'er myself ,haven't voluntarily watched a commercial, other than the superbowl ads with friends or ones I had heard about and wanted to critique, in years...
 
I guess I have been misunderstanding those charts for the last 15 years or so, having that data that goes back to the early 1950's.
I shall reach out to one of the folks at LLNL for clarifications in the near future, though they may have retired

In trying to understand the numbers on that chart I squinted hard and read the fine print:

"EIA reports consumption of renewable resources (i.e., hydro, wind, geothermal and solar) for electricity in BTU-equivalent vlaues by assuming a typical fossil fuel plant heat rate. The efficiency of electricity production is calculated as the total retail electricity delivered divided by the primary energy input into electricity generation. End use efficiency is estimated as 65% for the residential sector, 65% for the commercial sector, 21% for the transportation sector and 49% for the industrial sector, which was updated in 2017 to reflect DOE's analysis of manufacturing. Totals may not equal sum of components due to independent rounding."

Maybe I've misunderstood, but this seems to indicate that the numbers of 65% for residential and commercial, 21% for transportation, and 49% for industry is the energy used portion and the rest is waste.

If I have this right, then there is ~1/3 waste in residential and commercial, ~4/5 waste in transport, and ~1/2 waste in industry.

Transport appears to be the worst as it is 79% wasted energy, industry is a close second at 51%.

This does overwhelmingly support Tesla's mission focusing on Transport being prioritized and storage being ramped further only after the vehicle manufacturing was making a noticeable dent.
 
Last edited:
Don´t want to interrupt the discussion on efficiency ;)... But the next few days should be interesting, will we break call wall at $200 (max pain is at 190 even)? Pre-Market at 199, fed announcement on rate hike later today might move the needle.

View attachment 920111

Oh, I'm sure it WILL move the needle, the question is, "Which way?" ;)