GigaBerlin's VINs are sequencially increasing and the subset that are exported to Norway are public (at e.g.
Tesla Registration Stats), so the "German Tank Problem" is perfectly suited to estimate GigaBerlin's production:

en.wikipedia.org
With the expectation that the production rate at GigaBerlin is non-constant, the total production is less interesting than the recent rate of production on e.g. a weekly basis. As such one can base the estimate on the most recent D days - where for those D days the effective maximum observed VIN is the actual maximum observed VIN minus the maximum observed one D+1 days ago.
Because of the random nature of the day when a new maximum VIN is observed, the estimated rate of production is strongly dependent on the choice of D. Further, with a too small D, the fluctuations in the estimate are less likely to reflect actual production rate fluctuations and more likely to be an effect caused by the random nature of the maximum VIN occurrence. Lastly, with a too large D the estimate is at risk of being impacted by actual changes in the production rate during those D days.
To overcome this, one can compute the estimate for all meaningful values of D, e.g. D=7,8,9,... up to some limit where the production rate can be assumed to not have changed (e.g. some time after GigaBerlin's 2nd shift started). One can then make a histogram of the production estimates over D.
Based on this approach (for any histogram bucket size in the range 50 - 150) the average weekly production rate at GigaBerlin in the past 5, 6 and 7 weeks is about 1750.
Some expected, systematic errors in this approach:
1) There is some latency in a VIN being produced at GigaBerlin before it can be observed in Norway - basically the time to transport and register the vehicle there,
2) It is possible that certain production days are allocated to Norway, while others are not - e.g. if a whole train is going to be filled up with Norway exports. In such a case (a "Norway wave") the observed VINs will indicate a fluctuation in production rate which is not real but rather caused by a sampling bias. If this actually happens it seems to be on a timescale not discernible among the noisy samples.
I am not proud to write this, but after additional reflection I think my above use of the 'German Tank Problem' is incorrect.
Let me first describe how this proven estimate _can_ be used:
On Sept. 17 2022 Norway had seen 2085 VINs from GigaBerlin - the highest of which was 22625.
The 'German Tank Problem' then estimates the total production to be 22625 * ( 1 + 1/2085) - 1 = 22635.
We see that the estimate is only slightly higher than the maximum observed VIN - this is so because so many VINs have been observed, reducing the likelihood that even higher VINs exist. (Imagine the extreme case where all VINs up to the maximum has been observed, the estimate then equals the maximum).
As an opposite example, GigaBerlin VINs were first observed in Norway on April 13, the VINs 2669 and 2670. With only two VINs, the estimate of 2670*(1+1/2) - 1 = 4004 is (relatively) much higher, because the likelihood that unobserved, higher VINs exist is much higher.
It should be noted that GigaBerlin had a trial production of 2k Model Ys, so it is no great surprise that the first VINs observed are greater than 2k. It was subsequently reported that GigaBerlin received permission to sell also their trial production. And indeed, from May VINs smaller than 2k were observed with the smallest VIN observed being 130. So there is no reason to assume that some initial VIN range has to be ignored when calculating the estimate.
This is were the trouble starts.
Two days after the Sept. 17 maximum VIN was observed, a new maximum was observed: VIN 24561.
With the number of VINs seen having increased to 2195 the 'German Tank Problem' estimates the total production on Sept. 19 to be 24561 * ( 1 + 1/2195) - 1 = 24571. Fine.
However, the maximum VINs observed two days apart are _not_ independent events. Once the new maximum has been observed, this also affects what is the most likely total production two days before - and it would be wrong to assume that the new total production estimate is a result of production having taken place only during the time lapsed between the two observations. As such I have come to the conclusion that trying to deduce production rates based on simple differences of these 'German Tank Problem' estimates taken at face value on different days is _not_ a valid approach.
On a longer time scale, say a quarter of a year, I think the estimates are separated by enough time that one can assume their difference to be (largely) due to actual production during the elapsed quarter.
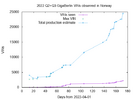
Unfortunately, no maximum VIN was observed close to the beginning of the current quarter - and as can be seen (more or less) from the attached plot, on June 22 a new max of 7385 was seen and then only on July 14 did it jump - to no less than 11433. So an estimate of the Q3 production (so far) would be strongly dependent on where one would estimate the production to be on July 1st, a number that can range from 7385 (plus 5 for the frequency correction) up to 11433 (plus 8 for the frequency correction).
As such I leave it as an open question what the GigaBerlin production rates are, with the observed GigaBerlin VINs on the attached plot. I am sorry about that.
If anyone can make a convincing argument of how one can deduce production rates from these numbers, then I will be happy to use the approach on the numbers (although the numbers are available to anyone, via e.g. teslastats.no).
I looked also at the GigaShanghai VINs observed in Norway and I would say that due to the strong 'delivery wave' the VINs are not helpful for deducing a production estimate.
To at least provide some modicum of useful information, I looked also at the split between the LR and P (and SR+ from China) for the current quarter in Norway (as of this moment):
CN(2222 VINs): 3-LR=24.3% (540 VINs) 3-P=13.5% (299 VINs) 3-SR+=11.2% (249 VINs) Y-LR=51.0% (1134 VINs)
DE(1757 VINs): Y-LR=32.2% (565 VINs) Y-P=67.8% (1192 VINs)
(Yes, the Ps exported from China to Norway are all Model 3, at least so far).
In principle, one could maybe use other information for the already lapsed Q2 to see how the splits correlate to a (more or less) already known ASP. As such I provide also the same splits for 2022 Q2 in Norway:
CN(1811 VINs): 3-LR=5.2% (95 VINs) 3-P=0.6% (10 VINs) 3-SR+=4.9% (89 VINs) Y-LR=89.3% (1617 VINs)
DE(1208 VINs): Y-P=100.0% (1208 VINs)
Unlike the 'German Tank Problem' estimates, these splits cannot be assumed to apply to the production as a whole, the splits can be different outside of Norway...