Welcome to Tesla Motors Club
Discuss Tesla's Model S, Model 3, Model X, Model Y, Cybertruck, Roadster and More.
Register

Teslas per Supercharger Stall Metric

This site may earn commission on affiliate links.
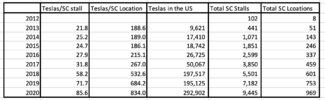
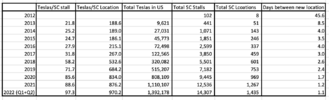
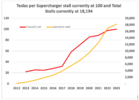
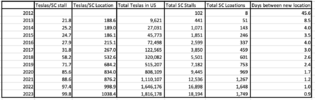
I put together a metric of that shows the number of US Tesla’s per US Supercharger stall as a quick number to understand the pace of the SC network build out compared to the size of the on road fleet and relative demand. This has change a lot over the past 6 years, see the table.

At the end of Q3 2019 there were 68 Tesla cars per Supercharger stall in the US, with 6,656 opened stalls. This metric doubled since the end of 2017, when there were about 38 Tesla cars per super charger stall, with 3,850 opened stalls. This high level metric of changing SC demand captures fleet growth rapidly outpacing Supercharger network growth since teh Model 3, and there may not be a quick reversal in the metric anything soon. As locations get added so does the relative demand. This got me wondering what is the golden number of cars/stall for Tesla longer term? And once there are SC locations every 30/50 miles on major highways, V3 is common place and more SC in urban centers and at destinations there may be no golden number, but rater a network that can handle increasing demand.

As a control I looked at gas pumps per ICE car. There are about 146 ICE cars per gas pump in the US (2015 numbers, ~150,000 stations*~12 pumps avg per station/263,610,000 cars) . With a decades long trend of declining numbers of gas stations and increasing numbers of cars, this has only gone higher over the past 4 years.

Anyways thought I’d share, there are probably better/more accurate numbers out there. I’m going to track this in the future to see how it changes.

Sources:
Teslas on the road: http://carsalesbase.com/us-car-sales-data/tesla/
Superchargers: supercharge.info
Gas Stations: How many gas stations are there in the U.S?
 

Attachments

  • Screen Shot 2019-11-17 at 9.32.36 PM.png
    Screen Shot 2019-11-17 at 9.32.36 PM.png
    58.4 KB · Views: 188
A few years ago someone else calculated this metric. At the time, it was clear that California had more Teslas on the road, per charger stall, than the rest of the country. I suppose that remains true today. One rationale for that, would be, that there are abundant non-Tesla, public, chargers throughout the state.

In the last three years, I've tended to rely, initially, on RV parks and J1772 chargers to help me bridge gaps in the Supercharger network. Now, I can go from Houston to Yellowstone using only Superchargers -- and without any significant departures from the most direct route.

Some factors that should make fewer chargers support more cars:
  1. People are now smart enough to charge at 'the bottom of the battery', and minimize their time at each charger;
  2. Chargers can operate at higher kW, and, the cars help with on-route warm-up;
  3. Greater availability of destination chargers. These chargers relieve the Superchargers of some 5-15% of the load on multi-day journeys; and
  4. Larger average range for the fleet.
On the other hand, in the last 3 years, urban chargers have been introduced. Those places that I've used the 'urban chargers', have, more often than not, been unusually busy. In at least one case, I believe the transformer on the site must have reached capacity, and my charge was, accordingly, throttled well below the nominal 72 kW that they can provide. These limited chargers probably should not be categorized in the same metric with the 150kW-capable superchargers.

Additionally, many of the chargers are aging, and in disrepair. Many have 'soft-failures', but others have damaged handles and are left in that state for many months. This too can be a factor.
 
  • Informative
  • Like
Reactions: nwdiver and ChadS
It's gonna be interesting to see how this evolves over time. I'm a little frustrated that it seems L2 >12kW is fading in favor of L3 <100kW like urban chargers. It also would have been nice if J1772 was explicitly compatible with 277v instead of just 240v. Having the ability to install L2 @ 277v would be almost as good as L3 at <10% the cost.
 
  • Like
Reactions: Rocky_H
A few years ago someone else calculated this metric. At the time, it was clear that California had more Teslas on the road, per charger stall, than the rest of the country. I suppose that remains true today. One rationale for that, would be, that there are abundant non-Tesla, public, chargers throughout the state.

In the last three years, I've tended to rely, initially, on RV parks and J1772 chargers to help me bridge gaps in the Supercharger network. Now, I can go from Houston to Yellowstone using only Superchargers -- and without any significant departures from the most direct route.

Some factors that should make fewer chargers support more cars:
  1. People are now smart enough to charge at 'the bottom of the battery', and minimize their time at each charger;
  2. Chargers can operate at higher kW, and, the cars help with on-route warm-up;
  3. Greater availability of destination chargers. These chargers relieve the Superchargers of some 5-15% of the load on multi-day journeys; and
  4. Larger average range for the fleet.
On the other hand, in the last 3 years, urban chargers have been introduced. Those places that I've used the 'urban chargers', have, more often than not, been unusually busy. In at least one case, I believe the transformer on the site must have reached capacity, and my charge was, accordingly, throttled well below the nominal 72 kW that they can provide. These limited chargers probably should not be categorized in the same metric with the 150kW-capable superchargers.

Additionally, many of the chargers are aging, and in disrepair. Many have 'soft-failures', but others have damaged handles and are left in that state for many months. This too can be a factor.
Any idea where a good source of registered Tesla’s per state and year could be found? This would give a shade more local relevance.
 
I’m updating this with 2020 numbers and some big news - 1,001 Supercharge locations are now active in the US according to supercharge.info !

At the end of Q4 2020 there were about 87 Tesla cars per Supercharger stall in the US, with 9,445 opened stalls. More interesting - at the end of Q4 2020 there were 969 Supercharge locations in the US. As of today (3/24/21) there are 1,001 US Supercharger locations this milestone was reached on 3/19/21 and seems to have gone unnoticed by the Tesla media. (Supercharger.info map page still shows 994 but the data page now shows 1,001) This gives a total of 9,752 stalls. I think number of locations are important for the network effect of road trips and the number of stalls are important for car density and peak period wait times. I’ll update again in a few months!

Note - the car sales numbers are updated with what I think are better numbers for the US from:
 

Attachments

  • Screen Shot 2021-03-24 at 12.06.03 PM.png
    Screen Shot 2021-03-24 at 12.06.03 PM.png
    58.9 KB · Views: 81
Last edited:
A lot has happened on the Supercharge front since I last updated these numbers. With the news that the SC network access might be opening up to other brand EVs, I though now is a good time to update these numbers through 2022 Q2.

At the end of June, 2022 there were about 97 Tesla cars per Supercharger stall in the US, with a total of 14,307 charging stalls. These stalls are spread across 1,435 Supercharge locations in the US. This is almost a 50% increase in both stalls and locations since 2020. I’m still not sure what the magic number is there, maybe it’s 150, or possibly 200 Teslas per stall. Obviously, the locations of SC are important for long distance travel and the number of stalls in high Tesla density areas can influence wait times, and this metric does not capture that.

I’ve added a new metric ‘Days between new SC locations’. This is interesting since is shows Tesla has been opening a new SC in the US every 1.1 days for the first half of 2022! Just before the Model 3 came out this metric was every 4 days. It will be interesting to see if they can keep this pace for the rest of 2022, since there are about 104 SC locations under construction and 192 in the permitting stage, but as Supercharge.info shows us, some locations are in the permitting stage for months to years.
 

Attachments

  • Screen Shot 2022-07-29 at 11.33.44 PM.png
    Screen Shot 2022-07-29 at 11.33.44 PM.png
    82.2 KB · Views: 70
  • Like
Reactions: Matsayz and MP3Mike
I’ve just updated this with numbers for the US through 2023 Q1. Tesla added more than 1 new Supercharge location each day in 2022 and nearly 100 Teslas are now sharing each stall.

At the end of March, 2023 there were about 99.8 Tesla cars per Supercharger stall in the US, with a total of 18,194 charging stalls. These stalls are spread across 1,749 Supercharge locations in the US.

This is a big increase in both stalls and locations since 2020. I’m still not sure what the magic ratio is for cars per stall, but as the number of Teslas on the road doubled since 2020, Teslas per stall has only gone up from 85 to 99.8 per stall. So nearly 100 Teslas share each stall now, as this number creeps up Superchargers are getting a little more crowded. Obviously, the locations of SC are important for long distance travel and the number of stalls in high Tesla density areas can influence wait times, and this metric does not capture that.

Tesla did keep pace in 2022 adding 381 new Supercharger locations, more than 1 per day! So far in 2023 they are on a faster pace at 0.9 per day! Just before the Model 3 came out this metric was one every 4 days. As of today there are 134 locations under construction.
 

Attachments

  • Screen Shot 2023-04-20 at 9.56.18 PM.png
    Screen Shot 2023-04-20 at 9.56.18 PM.png
    146.8 KB · Views: 44
  • Screen Shot 2023-04-20 at 9.58.10 PM.png
    Screen Shot 2023-04-20 at 9.58.10 PM.png
    86.2 KB · Views: 47
You would expect the number to go up. Early on, you need a lower number because you need chargers on all major roads. If you only had one car you would still need a thousand stations to let it drive the USA. The network is still not filled up enough, but it should be stabilizing and the curve flattening as you show. On the other hand, the CCS adapter now reduces some of the need to increase SC.