Welcome to Tesla Motors Club
Discuss Tesla's Model S, Model 3, Model X, Model Y, Cybertruck, Roadster and More.
Register

The Penultimate 2021 Model Y EPA Document

This site may earn commission on affiliate links.

SageBrush

REJECT Fascism
May 7, 2015
14,862
21,485
New Mexico
Do you find the Monroney sticker laughably deficient in technical details ?
This pdf is for you. It is the (I think) full CSI document for the AWD and Performance models

I found the cold weather testing information most interesting. I also expected to find the SC06 cycle data since I thought that was part of the 5 cycle regime but perhaps Tesla only used 3 cycles ?

One other detail sure to spark interest: the document says the P model has some 4.5 kWh more battery than the AWD. I haven't sat down to see if the other data is consistent with that difference or if it is a typo.
 

Attachments

  • 2021 Model Y CSI.PDF
    2.2 MB · Views: 150
Do you find the Monroney sticker laughably deficient in technical details ?
This pdf is for you. It is the (I think) full CSI document for the AWD and Performance models

I found the cold weather testing information most interesting. I also expected to find the SC06 cycle data since I thought that was part of the 5 cycle regime but perhaps Tesla only used 3 cycles ?

One other detail sure to spark interest: the document says the P model has some 4.5 kWh more battery than the AWD. I haven't sat down to see if the other data is consistent with that difference or if it is a typo.
Where does it say this? Pages 17 and 18 show a Wh/kg and kg that combines to equal 79.2 kWh for both?
 
Page 16, Section 18

The values are metered energy to recharge from empty to full. Note the difference between the models, not the values per se since they include charging losses.
Amount to charge doesn’t indicate battery capacity. Charging loss can vary quite a bit. From these forums it seems to be between 75-85% efficiency and who knows what variables were at play for those tests. A 10% charging efficiency difference could be an amount to charge difference of 8 kWh, even to the same battery on different charging instances.

The true capacity is privacy better calculated by the calculated energy density.
 
Amount to charge doesn’t indicate battery capacity. Charging loss can vary quite a bit.

Not when the identical EVSE is used. The specific loss isn't important, as a little Algebra shows:

L - charging efficiency, value < 1
B1 AC charging of 92.2 kWh
B2 AC charging of 87.6 kWh

Usable = charging kWh*L

B1_usable = 92.2*L
B2_usable = 87.6*L

B1/B2 = 92.2/87.6
B1 = 1.05*B2
 
Last edited:
Do you find the Monroney sticker laughably deficient in technical details ?
This pdf is for you. It is the (I think) full CSI document for the AWD and Performance models

I found the cold weather testing information most interesting. I also expected to find the SC06 cycle data since I thought that was part of the 5 cycle regime but perhaps Tesla only used 3 cycles ?

One other detail sure to spark interest: the document says the P model has some 4.5 kWh more battery than the AWD. I haven't sat down to see if the other data is consistent with that difference or if it is a typo.
This document is quite informative. Could you get also the new Model S Plaid information?
 
Here is the American consumption graph for the AWD long range, using the Dyno coefficients from the document.
The spreadsheet for the graph is here, for people who like that sort of thing or would like to check for accuracy.

Please let me know of any errors. I'll add a graph for KPH soon.

Screen Shot 2021-11-28 at 8.33.10 AM.png
 
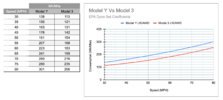
I used the Dyno coefficients from the EPA CSI documents to compare Model 3 to Model Y. I'm not sure of wheel/tyre differences.

Note: my earlier graph mixed up set and target values. The graph below uses 'set' values for each car.

Screen Shot 2021-11-29 at 8.12.06 AM.png
 
Last edited:
  • Like
Reactions: NHK X