Welcome to Tesla Motors Club
Discuss Tesla's Model S, Model 3, Model X, Model Y, Cybertruck, Roadster and More.
Register

Trip screen prediction always wrong Model 3 Performance 2021

This site may earn commission on affiliate links.
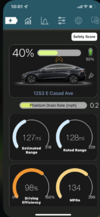
I'm facing a strange problem. I'm never able to match (not even be near) the prediction % at destination with my 2021 Model 3 Performance.
A typical example:
1642799056006.png


Disclaimer: I dont drive in a wrong way or in a too aggressive way or in a way considered inefficient, I always start with pre heated battery. Usually (if not always) in plain roads.
Example: the car is predicting to ends with a calculated consumption very LOW, I'd say TOO LOW (even extremely under the Epa average), so if I'm able to meet EPA consumption I'm still with green line UNDER the grey one.

With my old LR 2019 the graph was always inverted ( green line above the grey one).
 
Zoom out on the display, cause you're really only off by 1% SOC. Your heat isn't all that high, so it's probably not that. Do you think it was windy that day? Were you driving faster than the speed limit? Because I get the feeling that the car's trip prediction is based upon the speed limit, or just a little above it. When you look at your chart, the difference really happens in the first 6 or 7km. Do you recall whether you were going faster than the speed limit at the time? Did you have the heater on a higher temp setting?
 
Your doubts are reasonable , but 1% on a 5-6% trip is a 10% on a 50%-60% trip.
The pic is only an example of my usual trips. I repeat I always have the battery pre heated and I have not spikes of high consumpion at the beginning of the trips i do. I always follow speed limits expecially on town to town trips where there are many Police speed radar camera. So exceding the speed limit is not the case.
Temp Setting is very low for winter (18.5 °C = 66°F).

What I want to say is that I'm not concerned on the actual consumption of the car , but about the prediction that is TOO optimistic.

I mean: if the system predicts a 10% consumption on a normal plain trip assuming I'll drive at 170 Wh/km (275 Wh/mi) AND instead I go faster , with high temp on AC and i don't respect limits ending with an average of 200 Wh/km (320 Wh/mi), I can understand a graph with green line under the grey one.
BUT
Believe me I'm a champ on Hypermiling . It seems that the car is instead predicting that for the same trip i'll have a 130Wh/km! ! , so when with my Model 3 Performance I do instead a 150 Wh/km average, the graph still will be with green line under the grey one. And 150 Wh/km (240 Wh/mi) is even UNDER the EPA .

Teoretically It's like if I plan a trip of 600 km(372miles) (avoiding highway) and the system tell me that Ill be able to do it , then instead even having a EPA average (159 Wh/km) I'll be able to do only 490 km.

It seem the system believe that my car is a Model 3 SR+ with 18", not a Model 3 Performance with 20".

The fact is that my old LR 2019 was always with grey line under the green one because it was predicting reasonnable consumpion, NOT because it was able to do better average than my 2021 M3P .

just another example of december where the system was expecting to be more efficient than 160 Wh/km (EPA for a M3P is 159 Wh/km)
1642842517662.png


and see the average of last 25 km with no spikes of high consumption.
1642842668991.png
 
to hit expected consumption you have to use like.... cant remember 150wh/km or 149 or smth.
No, I'm speaking of the Trip Screen graph prediction. In the trip screen graph % prediction at destination, it take in account for sure:
the Difference in Altitude (positive or negative) and
the Speed limit of the Nav selected route.
I'm still in doubt about:
External Temp,
AC Temp selected in the cabin,
Traffic situation.
So if you plan a trip of 100 miles away and the Nav selects an "all Highway route" (with high speed limit) and the trip is slightly downhill, it will predict a medium/high consumpion than the EPA because of Highway speed limit.
If you return back from the same route it will predict an even higher consumption because of slightly huphill.
 
Last edited:
It seem the system believe that my car is a Model 3 SR+ with 18", not a Model 3 Performance with 20".

My energy graphs have always looked like this, and I've speculated the same (2019 Performance with the massive non-aero wheels). Have you also noticed that the battery indicator in miles remaining (or km remaining, as the case may be) is always laughably optimistic?

This is why I do all my trip planning in ABRP.
 
  • Like
Reactions: KenC
My energy graphs have always looked like this, and I've speculated the same (2019 Performance with the massive non-aero wheels). Have you also noticed that the battery indicator in miles remaining (or km remaining, as the case may be) is always laughably optimistic?

This is why I do all my trip planning in ABRP.

the battery indicator shows you the energy available in the pack NOT the miles remaining (i know, it doesnt make sense). the mile number is just based on the EPA number for a full non degradaded pack.
 
  • Like
Reactions: Kimmi
Your doubts are reasonable , but 1% on a 5-6% trip is a 10% on a 50%-60% trip.
The pic is only an example of my usual trips. I repeat I always have the battery pre heated and I have not spikes of high consumpion at the beginning of the trips i do. I always follow speed limits expecially on town to town trips where there are many Police speed radar camera. So exceding the speed limit is not the case.
Temp Setting is very low for winter (18.5 °C = 66°F).

What I want to say is that I'm not concerned on the actual consumption of the car , but about the prediction that is TOO optimistic.

I mean: if the system predicts a 10% consumption on a normal plain trip assuming I'll drive at 170 Wh/km (275 Wh/mi) AND instead I go faster , with high temp on AC and i don't respect limits ending with an average of 200 Wh/km (320 Wh/mi), I can understand a graph with green line under the grey one.
BUT
Believe me I'm a champ on Hypermiling . It seems that the car is instead predicting that for the same trip i'll have a 130Wh/km! ! , so when with my Model 3 Performance I do instead a 150 Wh/km average, the graph still will be with green line under the grey one. And 150 Wh/km (240 Wh/mi) is even UNDER the EPA .

Teoretically It's like if I plan a trip of 600 km(372miles) (avoiding highway) and the system tell me that Ill be able to do it , then instead even having a EPA average (159 Wh/km) I'll be able to do only 490 km.

It seem the system believe that my car is a Model 3 SR+ with 18", not a Model 3 Performance with 20".

The fact is that my old LR 2019 was always with grey line under the green one because it was predicting reasonnable consumpion, NOT because it was able to do better average than my 2021 M3P .

just another example of december where the system was expecting to be more efficient than 160 Wh/km (EPA for a M3P is 159 Wh/km)
View attachment 758773

and see the average of last 25 km with no spikes of high consumption.
View attachment 758774
I agree with TSTeve, have you checked that the car knows you are on 20" tires. There's a setting where you can spec the tire size.

I also agree with megant113 that it's useful to use ABRP, since it's far more accurate compared to the car's trip planner.

I also agree with drtimhill in that the change is not linear, so you can't extrapolate a 1% change in 5% SOC change to a 10% diff in a 50% SOC change. As I pointed out, the biggest difference happened in the first 5-6km. Then the difference was minimal onward.

Which brings me to another question, all of your examples are short trips, does the error also apply to long trips, and does the error increase linearly?

Also, in your last example of a 15km trip, did something occur in the 9km to 12km period? Did the heater kick in? While the consumption graph doesn't show a big change, the fact is, your prediction graph shows a horizontal flattening in the 9km to 12km area, meaning that consumption should have been below average. Your consumption graph shows an increase in the 9km to 12km area. It's the difference from expectation that results in a difference shown.
 
There are many good considertions in your replies.
1)It happens in long trip too and with divergent progressive increase consuption
2)The setting of wheels is correct: 20" Uberturbine
3)I also tried to change it to 20" Track pack , but it's always the same.


Yesterday I finally had a proof:
FInally i found a car like mine at the local supercharger.
I asked to the guy to select a trip 52 km away from us to a location
We were in the same position , we selcted the same destination, both we were in the 70% range SoC.
He had 13% from 72% to 59% graph (probably 12,5-12,8 judging by the graph)
Me 10% , from 68 to 58% (probably 10,2% judging by my screen graph).
this is a difference in prediction of about 25 to 30% !

At this point the ONLY GUESS I have is the; HISTORY CAR consumption:
While me I'm at 168 Wh/km in 20000km (confirming the fact that I'm not an aggressive driver...) and him with 217 Wh/km historical average in about 12000km total.

About this: " I also agree with drtimhill in that the change is not linear, so you can't extrapolate a 1% change in 5% SOC change to a 10% diff in a 50% SOC change. As I pointed out, the biggest difference happened in the first 5-6km. Then the difference was minimal onward."

here a yesterday trip of 113 km with 80% of the route in highway with 130 km/h limit. with progressive divergent prediction
1643564655174.png

The system was predicting from 84% to 61,3% , so only a 22,7% consumption to do 113 km! where 80% of the trip is an highway with 130km/h limit (that I never exceded, instead I made also long parts at 120 km/h due traffic situation)
I ended with a 31% total consumption (from 84% to 53%) with an average of 193 Wh/km .
The consumption of the car is Ok , the prediction is wrong.
 
  • Informative
Reactions: KenC
Interesting! It's as if, the car is making summertime predictions and not wintertime ones. I've forgotten, but does the Tesla trip planner use ambient temps? Are you on the current software?
I don't know if it uses ambient temp and/or selected AC temp in the cabin (I was supposing Yes).
Yes I have the current Software: 2021.44.30.11
Curious is that a Twin car (2021 Tesla Model 3 Performance) predicts different than mine.
Probably the Historical consuption selects a coefficient to apply to the prediction, and, me, having a lower historical consumption than the avrage fleet on M3Perf , puts a coefficient like 0.9 or 0.8 .
Puzzling. Other than using ABRP for any serious road tripping, I'd take it to the service center, when convenient, and try to see if they have any answers for the odd trip predictions. How's the 3 in the fog around Milan? Does AP help? Haven't driven there in a couple decades, but the fog there was insane!
 
  • Like
Reactions: drtimhill
Puzzling. Other than using ABRP for any serious road tripping, I'd take it to the service center, when convenient, and try to see if they have any answers for the odd trip predictions. How's the 3 in the fog around Milan? Does AP help? Haven't driven there in a couple decades, but the fog there was insane!
+1 on this .. feed the numbers into ARBP and see what it predicts (and let us know!). We need another data point to how ein on the root cause.
 
About ABRP:
1643618659064.png


so I have confirmation that the original prediction of the Tesla Trip screen was too optimistic.
Tesla Trip prediction : from 84% to 61%
ABRP trip prediction : from 84% to 51%
My real consumption: from 84% to 54%. (just because I'm a efficient driver)
 
  • Informative
  • Like
Reactions: AAKEE and KenC