Electrifying
Member
Wow, reached $255 3 days before my prediction!on 30 minute chart, 238 area is trendline support and if the trendlines stay intact, I think we may see 255 by Friday.
Last edited:


You can install our site as a web app on your iOS device by utilizing the Add to Home Screen feature in Safari. Please see this thread for more details on this.
Note: This feature may not be available in some browsers.
Wow, reached $255 3 days before my prediction!on 30 minute chart, 238 area is trendline support and if the trendlines stay intact, I think we may see 255 by Friday.
Looks good... Also $290s is the ATH so that'll definitely act as resistance.. If you want to play this, I might recommend waiting a bit as prices stabilize and consolidate around $250s before buying options (unless you plan on getting LEAPS) that way you can maximize your profits. Also get out ~$5 or so before your price target (eg. maybe $280-$285)...Based on my understanding of a V Bottom Chart pattern this is my thinking:
View attachment 170961
A measured move off the V Bottom to $290 with the trend continuing up after meeting the target price.
Thoughts?
I was thinking the same thing before I read this thread today, so maybe a lot of people are thinking the same thing and it will play out that way. Probably a smart area for people to sell short and medium term calls if they still have them at that point or hedge them by converting to spreads. I'm thinking it will take the ER in May to go to ATHs but who knows.Looks good... Also $290s is the ATH so that'll definitely act as resistance.. If you want to play this, I might recommend waiting a bit as prices stabilize and consolidate around $250s before buying options (unless you plan on getting LEAPS) that way you can maximize your profits. Also get out ~$5 or so before your price target (eg. maybe $280-$285)...
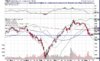
The TSLA chart is currently quite interesting. We just broke the 200 day SMA, and seem to be poised to close the $240 gap from 12/31/15 - 01/04/2017. This will bring us up into the October-November-December regression channel. The 20-day SMA had crossed the 50-day SMA last week, and gap between them is still increasing, with a slow and steady increase in volume through the last week. All of the above is unfolding on the background of macro tail winds with the same trader who predicted oil dip to $26 last November, is speculating that current oil climb will continue until it hits $49 (I know - the enthusiasm about the oil price action seems pretty irrational to me - but what do I know...)
I am in the process of setting up time delayed spreads (bought lower legs - Jan 2017 $190 and $220 and April 15 $230 - all green now). My original plan was to sell upper legs as we close the $240 gap, but I am wondering whether it is more likely at this point that as TSLA closes the $240 gap and runs into the old regression channel, it might continue the run-up to the $260 resistance point.
Anybody wants to share their thoughts on this?
View attachment 167996
All signs point to a 240 support level. I am looking at the fact that it is the same as a lot of recent tops and also happens to be the 20day:
View attachment 171931
Also happens to be the bottom of your regression channel. I think I will look at it to find support there and confirm up and buy back in harder. I did a pretty good job of acting on a top for once, trying hard not to get back in too early as I love to do so much.
I think the V invalided the channel. A new channel was formed from 140 to now. Still intact I think.Well, the interesting part is that TSLA seem to settle right back into the (10/12/2016-1/04/2016) regression channel. Very curious to see if it will follow it. It looks like it just got back on track after violent and swift "V" bottom. I am still holding my Jan 2017 $190 and $220, hoping to sell the higher leg of the spread as we bump against the upper boundary of this channel within the next couple of weeks. We do seem consolidating in the lower half of the channel on decreasing (since bursting into the channel) volume.
View attachment 171846
All charts seem to point to ~$285 as the top of the channel, and the next major resistance point. Thoughts?
All charts seem to point to ~$285 as the top of the channel, and the next major resistance point. Thoughts?
Well, the interesting part is that TSLA seem to settle right back into the (10/12/2016-1/04/2016) regression channel. Very curious to see if it will follow it. It looks like it just got back on track after violent and swift "V" bottom. I am still holding my Jan 2017 $190 and $220, hoping to sell the higher leg of the spread as we bump against the upper boundary of this channel within the next couple of weeks. We do seem consolidating in the lower half of the channel on decreasing (since bursting into the channel) volume.
$205.195 would mark a 50% retracement of the rise from the intraday low of $141.05 on February 9th to the high of $269.34 on April 7th. Such a retracement is often a setup for strong a return to the upside. It need not be exact. Today’s low of $206.80 could well have been sufficient.