3Victoria
Active Member
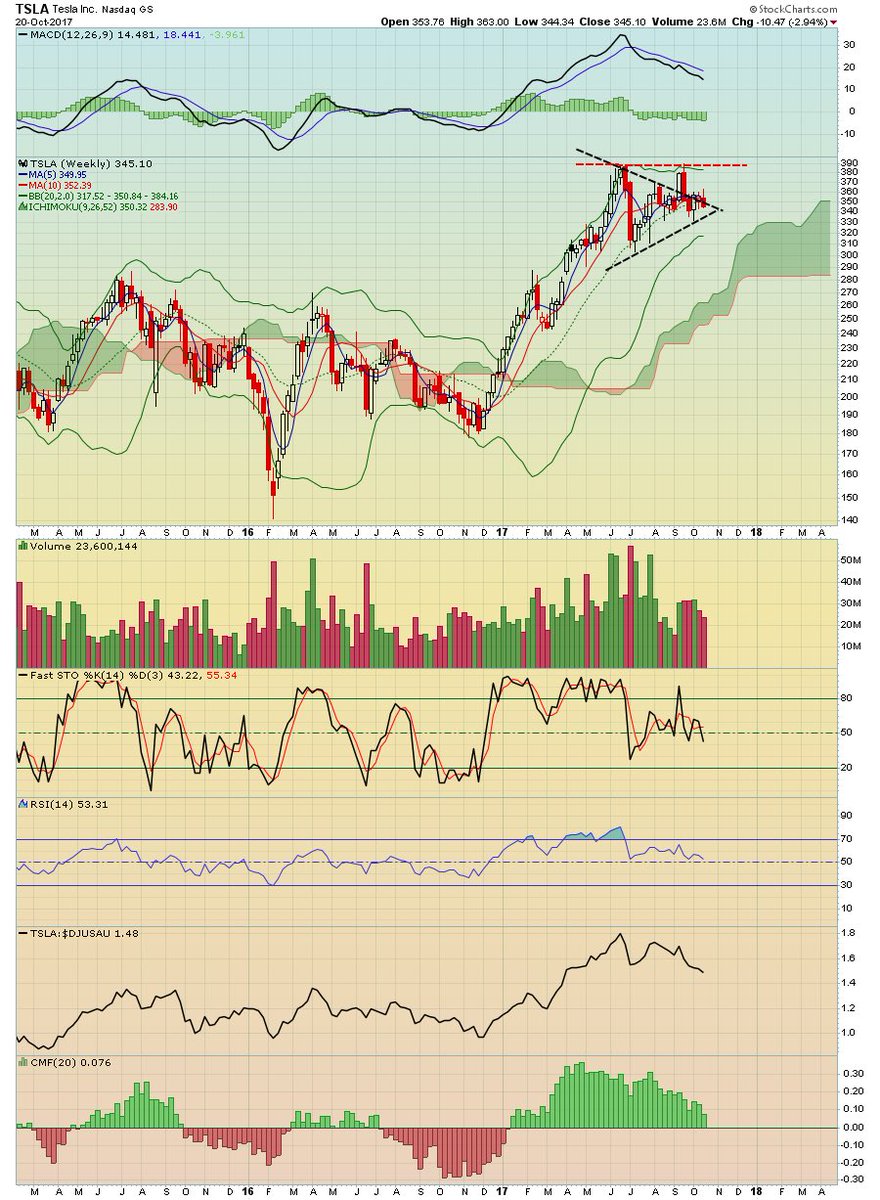
I am a complete neophyte to TA. However, I can now recognize triangles, and they certainly look like a damped ringing pattern. I am just not sure how one interprets what happens at the end of the ringing. I guess that depends on which the two forces creating the ringing wins out.