


Welcome to Tesla Motors Club
Discuss Tesla's Model S, Model 3, Model X, Model Y, Cybertruck, Roadster and More.
Register
Install the app
How to install the app on iOS
You can install our site as a web app on your iOS device by utilizing the Add to Home Screen feature in Safari. Please see this thread for more details on this.
Note: This feature may not be available in some browsers.
-
Want to remove ads? Register an account and login to see fewer ads, and become a Supporting Member to remove almost all ads.
You are using an out of date browser. It may not display this or other websites correctly.
You should upgrade or use an alternative browser.
You should upgrade or use an alternative browser.
TSLA Technical Analysis
- Thread starter Robert.Boston
- Start date
-
- Tags
- elon is an ass TSLA
Or possibly level 2 (god I hope not).@GoTeslaGo: Could the level 4 dip correlate somewhat with the bottom? If so, then we could be near the bottom.
For tomorrow (11/3) below are some possible price points by closing. First, the BB(20,2) and BB(20,3).


_____________________________________________________________________________________________________________
Here's the BB(30,3). SP closed today just below the BB(30,3), very atypical. The big question is whether the Model 3 production delay a sufficient catalyst to "shift the mean" of the past trading distribution. If it is, we continue to close below the BB(30,3) range. If not we close right at it or inside of it (similar to the V drop of Feb 2016) and we ride the lower BB(30,3) band down until sentiment reverses. It's also possible we close back closer to the BB(20,2) lower band. I don't think we go down as far as the BB(20,3) band, but who knows.

For reference, here's the BB(30,3) and SP chart going back the last couple of years.

_____________________________________________________________________________________________________________
Here's the BB(30,3). SP closed today just below the BB(30,3), very atypical. The big question is whether the Model 3 production delay a sufficient catalyst to "shift the mean" of the past trading distribution. If it is, we continue to close below the BB(30,3) range. If not we close right at it or inside of it (similar to the V drop of Feb 2016) and we ride the lower BB(30,3) band down until sentiment reverses. It's also possible we close back closer to the BB(20,2) lower band. I don't think we go down as far as the BB(20,3) band, but who knows.
For reference, here's the BB(30,3) and SP chart going back the last couple of years.
geneclean55
Active Member
Below is the Elliot wave pattern generated by Fidelity Investments.View attachment 257898
Ok, here’s what I’m seeing with TSLA based on my interpretation of EW. So typically Wave 5 will exceed Wave 3, EXCEPT with a truncated wave 5 (rare, but happens). Assuming that Wave 5 is truncated, then we can start drawing the corrective cycle. The pattern is pretty much straight down, fits a Zigzag pattern, which is a classic 3 wave corrective cycle (A-B-C).
The trough will follow a parallel trendline determined by the points drawn from the peak of wave 5 to the peak of wave B. The bottom line follows from wave A to C. Sorry for the thick lines, but I think everyone gets the picture. The bottom should be determined by the trendline. Whether today is the bottom, I don’t know.
It seems to have overlaid one Elliot wave pattern over the other? Or you can break each big wave into smaller constituents? Not an expert. The underlying pattern seems the same as yours.
bdy0627
Active Member
Going off history relative to BBs, it seems unlikely we would dip much below where we are now. In fact, it doesn't look like we have spent much time at this depth for long at all. A few days or so? Hmmm. I'll be looking for signs that the stock is ending this bear cycle.For tomorrow (11/3) below are some possible price points by closing. First, the BB(20,2) and BB(20,3).
View attachment 257902 View attachment 257901
_____________________________________________________________________________________________________________
Here's the BB(30,3). SP closed today just below the BB(30,3), very atypical. The big question is whether the Model 3 production delay a sufficient catalyst to "shift the mean" of the past trading distribution. If it is, we continue to close below the BB(30,3) range. If not we close right at it or inside of it (similar to the V drop of Feb 2016) and we ride the lower BB(30,3) band down until sentiment reverses. It's also possible we close back closer to the BB(20,2) lower band. I don't think we go down as far as the BB(20,3) band, but who knows.
View attachment 257900
For reference, here's the BB(30,3) and SP chart going back the last couple of years.
View attachment 257904
Below is the Elliot wave pattern generated by Fidelity Investments.
It seems to have overlaid one Elliot wave pattern over the other? Or you can break each big wave into smaller constituents? Not an expert. The underlying pattern seems the same as yours.
View attachment 257905
Yes, basically Elliot Waves are made of subwaves, so theoretically Wave 1 should have a whole series of subwave 1 through 5, etc, etc... very fractal in a sense. Each Wave 2/4 are essentially little corrective wave cycles, etc...
I had thought that pattern that you posted was the case, but I found the corrective wave from (1) to (2) to be “unsatisfying” as a pattern...because it was just too long and the corrective pattern was too much like at Triangle formation, which from my reading is usually more associated with Wave 4, not Wave 2.
So I actually had that pattern at first, but discarded it because of that basis. Instead it seemed to me that the wave (2) was more likely a part of a double corrective wave (triangle pattern), following after another corrective wave (IIRC, I believe flat). I agree, the natural tendency is to see the bottom of Feb 2016 as the beginning of Wave (1)... but from what I saw for Wave (2), there were just too many corrective waves for it to be a convincing Zigzag or Flat pattern (typically 3 waves)—and Triangle corrective patterns (typically 5 internal waves) usually occur with a Wave 4.
So my view is that Fidelity’s major Wave (3) is actually a major Wave (1)... so I’m actually more bullish in that regard since that would mean we are just starting
") . That would mean we will never have the SP drop back to 178-180, since that is the beginning for that major wave (1)... and the rule is wave 2 can never retrace the entire wave 1.
. That would mean we will never have the SP drop back to 178-180, since that is the beginning for that major wave (1)... and the rule is wave 2 can never retrace the entire wave 1.However, if we do use Fidelity’s waves, then we can say that this correction is a major wave (4) and will not drop below the peak of their wave (1), which is 270 (!!
don’t tell someone who usually posts elsewhere!!). So I can be swayed back to their pattern...@AlMc , it’s my understanding that unfortunately once the pattern goes into a corrective cycle the Wave 4 support doesn’t apply. With the caveat that we may be entering into a major wave (4) pattern as Fidelity drew—which would give us a bottom for a major wave (4) of 270.
Hence we can understand why a lot of traders don’t like EW... the subjectivity.
FWIW Wave 5 has been looked upon as the retail investors’ wave, spurred on by small investors exuberantly buying. Hence it makes sense that one can get a truncation with Wave 5–since retail investors are more likely to be spooked out of the trade. Wave 1 and 3 are supposedly driven by institutional buyers... which would jive with our understanding of Tencent buying from November to Feb (Wave 1).
Sorry for the long post. Thanks for posting that Fidelity chart, it’s making me re-visit some original ideas and assumptions...
We are now back in the BB(20,2) trading range. We bounced right off the lower BB(30,3). Would be great if we could recover back to the 200SMA, but sentiment is still pretty negative. We might close below the lower BB(20,2), but above the lower BB(30,3) Monday.

Here are the key price points for the lower BB(20,2) & BB(30,3) for Monday (11/6).


Here are the key price points for the lower BB(20,2) & BB(30,3) for Monday (11/6).
So I was playing around with EWs and noticed an interesting pattern. It seems that Motive waves tend to stay above the 10MA on the monthly charts whereas corrective patterns tend to flip back and forth across the 10MA! Here's an example with my interpretation of the EW waves, and with a stock with much less short interest: WMT

Numbered waves are motive waves, lettered waves are corrective waves. Seems to me WMT went through a long back to back to back corrective cycle, also flipping back and forth across the 10MA. Motives are pretty much almost all above the 10MA.
Numbered waves are motive waves, lettered waves are corrective waves. Seems to me WMT went through a long back to back to back corrective cycle, also flipping back and forth across the 10MA. Motives are pretty much almost all above the 10MA.
So here's TSLA, using what I am assuming Fidelity has charted:

My issue is the Wave 1 development and wave 2 movement. They are crossing above and below the 10MA... too much like a corrective wave.
Obviously this has the violation of the Wave 4 into Wave 1 rule that @Curt Renz had pointed out along time ago, but if we use the 10MA to help ID the waves, it fits. I'm going to make the assumption that it's an "exception" due to the high short interest mucking everything up.
So using the 10MA rule to help define EW pattern, here's my interpretation:

Unfortunately leaves us in the situation where we won't know where the corrective wave will bottom. But in terms of trying to ID where the stock is (motive/corrective), I feel the monthly 10MA will give us good data to get a sense of where things are.
Unfortunately leaves us in the situation where we won't know where the corrective wave will bottom. But in terms of trying to ID where the stock is (motive/corrective), I feel the monthly 10MA will give us good data to get a sense of where things are.
It helps sometimes to look more from the distance.
Resistance at 292 $ as most of you know already.
We have been quite some time in the lower band before (3,5 years) and may need a strong flow of positive news to break out above 289$. Last time we had an up move of 119% (177 $ to 389$). A similar move would bring us to $ 650 but I don't call that likely.
Its more realistic I believe to assume a smaller step and brake out already in 2018 once M3 production is ramping up and later the year when predictions about a cash flow positive situations gain ground.
Attachments
It helps sometimes to look more from the distance.
Resistance at 292 $ as most of you know already.
We have been quite some time in the lower band before (3,5 years) and may need a strong flow of positive news to break out above 289$. Last time we had an up move of 119% (177 $ to 389$). A similar move would bring us to $ 650 but I don't call that likely.
Its more realistic I believe to assume a smaller step and brake out already in 2018 once M3 production is ramping up and later the year when predictions about a cash flow positive situations gain ground.
Thank you for your fine analysis. I assume you are referring to the fact that the region around $292 was in the past a resistance level, and it now may serve as a support level. Indeed, levels proven to have been strong resistance in the past, often serve as launching pads for sharp rebounds.
Thank you for your fine analysis. I assume you are referring to the fact that the region around $292 was in the past a resistance level, and it now may serve as a support level. Indeed, levels proven to have been strong resistance in the past, often serve as launching pads for sharp rebounds.
My pleasure. Yes thats been exactly what I was trying to say.
geneclean55
Active Member
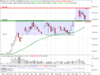
Looky looky
I usually prefer ascending triangles that form over 1-2 weeks. But considering the one below includes some high volume days, it might do the trick anyways... lot of shorts piled on sub 299
Upside would have us banging up against the 200day MA. Funny how that happens
Regardless, I reckon we move out of the 300-307 range in the next couple days.
CNBC - After today's close: Three stocks to buy on the dip
The third one analyzed technically is TSLA.
I agree that the three tops seen in the $280's from 2014 through early this year have proven to be support over the last six months. That is often the case when resistance that's been demonstrated several times is eventually exceeded. A number of TMC members have been looking for the $280's as a potential buying area, but I suspect that the $292.63 low on November 2 will be as close as it ever again gets.
This is from my friend Tom McClellan regarding the QQQ drop on Wednesday possibly marking a washout of bears.
QQQ Volume Gave Us a Tell - Free Weekly Technical Analysis Chart - McClellan Financial
QQQ Volume Gave Us a Tell - Free Weekly Technical Analysis Chart - McClellan Financial
Monthly Chart. Another test of the support (previous resistance) passed successfully. We all stand much better on two...
The now again confirmed support at about 288 gets stronger with every successful test and can develop into a solid base for an expected run to 389 again. When this will happen is the $1M question.

The now again confirmed support at about 288 gets stronger with every successful test and can develop into a solid base for an expected run to 389 again. When this will happen is the $1M question.
Similar threads
- Replies
- 21
- Views
- 6K
- Replies
- 4
- Views
- 348
- Replies
- 3
- Views
- 897
- Locked
- Replies
- 0
- Views
- 3K