


Welcome to Tesla Motors Club
Discuss Tesla's Model S, Model 3, Model X, Model Y, Cybertruck, Roadster and More.
Register
Install the app
How to install the app on iOS
You can install our site as a web app on your iOS device by utilizing the Add to Home Screen feature in Safari. Please see this thread for more details on this.
Note: This feature may not be available in some browsers.
-
Want to remove ads? Register an account and login to see fewer ads, and become a Supporting Member to remove almost all ads.
You are using an out of date browser. It may not display this or other websites correctly.
You should upgrade or use an alternative browser.
You should upgrade or use an alternative browser.
TSLA Technical Analysis
- Thread starter Robert.Boston
- Start date
-
- Tags
- elon is an ass TSLA
Jonathan Hewitt
Active Member
So to summarize several technical analysis types and add some of my own commentary...It looks like we are currently backtesting the big downtrend that we broke out of today. Backtesting breakouts is very common and no cause for alarm. MMs needed to get the stock under control before losing too much money to retail traders buying calls so that could have been a factor as well. Good thing is we are still above the daily cloud, which will provide support. OS mentioned 50/50 chance of retest of $334 before breaking out again. Idk why but I don't see why not either. The cloud slopes down so even if we retest $334 the daily cloud will still be support it looks like so that's pretty nice. Oh and my 401K rollover money still hasn't shown up so a move back to $334 would be nice if it shows up tomorrow.

Key watching out here is the weekly chart is still set up very well and is indicating a rise next week. I mentioned yesterday that MACD on the weekly was looking good. The crossover should happen next week. Notice how since the June top MACD has had a negative slope on both the black and red lines until the black line has recently flattened. Guess when the last time we reached a point like this? That's right, December of 2016. We all know what happened from Dec 2016 until June 2017. Hopefully we actually get the crossover but as all things with TA, nothing is guaranteed.

Key watching out here is the weekly chart is still set up very well and is indicating a rise next week. I mentioned yesterday that MACD on the weekly was looking good. The crossover should happen next week. Notice how since the June top MACD has had a negative slope on both the black and red lines until the black line has recently flattened. Guess when the last time we reached a point like this? That's right, December of 2016. We all know what happened from Dec 2016 until June 2017. Hopefully we actually get the crossover but as all things with TA, nothing is guaranteed.
Attachments
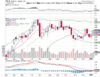
Given the positive sentiment, below are the BB(20,2) and BB(30,3) cross over points for tomorrow, just in case we have a good day.


I like keeping an eye on the BB(30,3) because it acts more like a hard stop compared to the BB(20,2) which we can trade above for several days before coming back into the 2sigma band.

I like keeping an eye on the BB(30,3) because it acts more like a hard stop compared to the BB(20,2) which we can trade above for several days before coming back into the 2sigma band.
Last edited:
I can’t help but feel that I jynxed us with that post.Given the positive sentiment, below are the BB(20,2) and BB(30,3) cross over points for tomorrow, just in case we have a good day.
View attachment 272652
View attachment 272653
I like keeping an eye on the BB(30,3) because it acts more like a hard stop compared to the BB(20,2) which we can trade above for several days before coming back into the 2sigma band.
View attachment 272654

bdy0627
Active Member
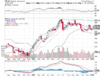
Here's a chart from Option Sniper a few days ago. With the manipulation that appears to be going on, I don't know how true this is, but the upper line of the downtrend channel is right around $336. We broke through it a couple of days ago, so in theory it would become support once above it. However, when we came back down below the line, it would turn into resistance again. That may be part of what is happening. However, the last couple of days of trading appear to be dominated by substantial manipulative trading rather than straight-forward market forces. In that environment, I'm not sure that this resistance line is very important. We sure went through it easily a few days ago. I think the antidote to manipulative trading is primarily volume.

bdy0627
Active Member
Option Sniper said yesterday there was a 50% chance of dip to $334 before climbing next week. It did dip to just below $334 today and then came back up a couple of bucks. Let's see if he's right about next week.
Reciprocity
Active Member
Option Sniper said yesterday there was a 50% chance of dip to $334 before climbing next week. It did dip to just below $334 today and then came back up a couple of bucks. Let's see if he's right about next week.
The dude is a damn wizard. I cant tell you how much money I have lost not listening.. haha. Im like.. nah, its going to go up.. and damned if OS doesn't nail it. Some of his estimates are uncanny in how accurate. Not 100% right, but I would guess 85%, which is off the charts for this kind of stuff. I think he said he made, as in cashed out to his bank account, $470k this year already. So I will follow him as long as he keeps tweeting. Seems like a good guy as well. Very responsive to followers and never a jerk, unless you question weather you should cash out to your bank account, then he gets perturbed and starts typing in all caps to cash out or you didnt make anything. Sounds like a guy who has lost it all a few times. I am happy to listen and learn.
Edit: haha.. retweeted just now.. dude is serious:
Option_Sniper Retweeted

Option_Sniper @option_snipper
1d
FOLKS, I USE ALL CAPS FOR THIS TWIT SO YOU WILL PAY ATTENTION. AFTER THIS WHOLE CRAZY RUNS & POSSIBLY NEXT WEEK, YOU REALLY NEED TO CASH OUT ALL GAINS TO BANK ACCT OR YOU WILL BE SCREWED. IF U NEVER LISTEN, U WILL SUFFER ONE DAY - PROFITS ALL GONE QUICK. THIS IS SURVIVAL RULE.
Last edited:
Seems like SP gets rejected from 336 every time. Is that some sort of resistance level?
The candle is squeezed between the downwards trend line at 336.5 and the 100 MA at 334 (support)
geneclean55
Active Member
option_sniper is doing a Q&A session on twitter tonight between 10 and 11pm EST
The Tesla intraday chart this afternoon appears to have drawn a bullish Inverse Head & Shoulders pattern accompanied by heavy trading volume. It looks like a washout of weak longs (largely day traders) and covering by some of the smarter shorts. The fact that TSLA today is outperforming the averages and other momentum stocks also should bode well.
$345.00 had been resistance. TSLA has now pushed above with volume. Holding above could be seen as a bullish signal. The activity points toward institutional interest, and perhaps some short covering.
ev-enthusiast
Active Member
In addition I have the 0.618 Fib line at $347.5, is that correct?$345.00 had been resistance. TSLA has now pushed above with volume. Holding above could be seen as a bullish signal. The activity points toward institutional interest, and perhaps some short covering.
Last edited:
bdy0627
Active Member
Why does he say that it's almost impossible for it to not hit $341 in February, no matter how high it goes before?
Richgoogol
Member
That’s the part I don’t get either. If someone here understands, please enlighten me. The only thing I can think of is that TSLA tends to run up before the delivery report and earnings and then quickly goes down before the announcements. But I doubt that’s what he means since he’s totally coming from a TA perspective.Why does he say that it's almost impossible for it to not hit $341 in February, no matter how high it goes before?
Zhelko Dimic
Careful bull
Every trend gets tested, so for a new uptrend, it makes sense that there is a pullback to 5/10 MA, before braking down or continuation. At that point I trust news will bias us one way or another. If M3 production is doing well in Feb., we're due for trend continuation upward, if not...Why does he say that it's almost impossible for it to not hit $341 in February, no matter how high it goes before?
Similar threads
- Replies
- 21
- Views
- 6K
- Replies
- 4
- Views
- 354
- Replies
- 3
- Views
- 900
- Locked
- Replies
- 0
- Views
- 3K